More memory leaks: JVM and JRuby
The casual reader can get the impression that I do nothing else right now than debug memory leaks. This is luckily quite far from the truth. ![]() It just happens to be that I haven't had the chance to write about other things recently.
It just happens to be that I haven't had the chance to write about other things recently.
(The above is a reference to this post which was written a while ago. The preconditions there are different there though, and the root cause is also different.)
We have an app running on JRuby and JVM, which is leaking a lot of memory. It has to be restarted with a few days intervals. The app was previously running on Windows, but was recently moved to Linux. Previously, the server was scheduled to reboot every night, which "worked around" the memory leaks in a very silly and stupid (but working!) way.
Now, with the new setup, there are no such scheduled reboots any more, and so, the application is running out of memory.
The app was restarted yesterday. Right now, this is the memory usage:
root@microservice-jruby-xxxxxxxxxx:/# ps -ax -o pid,rss | grep 9762
 9762 2451060
As a first step, I activated -XX:+UseConcMarkSweepGC in JAVA_OPTS, which doesn't help the memory leak per se but makes sense on this environment anyway.
Then I Installed the openjdk-8-jdk-headless Debian package to get the jmap tool, which is useful for gathering heap dumps.
Re-learning how to create a heap dump
I have been making heap dumps before, but only on Windows. I tried now to make a dump on this Linux machine, but failed. It first complained about non-aligned memory address (might have been because JRE version was upgraded when I installed the openjdk-8-jdk-headless package, so restarted the process), then complained about this:
root@microservice-jruby-xxxxxxxxxx:/home/ecraft/apps/deliveryplanner-backend# jmap -dump:format=b,file=/tmp/heapdump-20170926-0901 -F 7410
Attaching to process ID 7410, please wait...
Debugger attached successfully.
Server compiler detected.
JVM version is 25.131-b11
Dumping heap to /tmp/heapdump-20170926-0901 ...
Exception in thread "main" java.lang.reflect.InvocationTargetException
    at sun.reflect.NativeMethodAccessorImpl.invoke0(Native Method)
    at sun.reflect.NativeMethodAccessorImpl.invoke(NativeMethodAccessorImpl.java:62)
    at sun.reflect.DelegatingMethodAccessorImpl.invoke(DelegatingMethodAccessorImpl.java:43)
    at java.lang.reflect.Method.invoke(Method.java:498)
    at sun.tools.jmap.JMap.runTool(JMap.java:201)
    at sun.tools.jmap.JMap.main(JMap.java:130)
Caused by: java.lang.InternalError: Metadata does not appear to be polymorphic
    at sun.jvm.hotspot.types.basic.BasicTypeDataBase.findDynamicTypeForAddress(BasicTypeDataBase.java:278)
    at sun.jvm.hotspot.runtime.VirtualBaseConstructor.instantiateWrapperFor(VirtualBaseConstructor.java:102)
    at sun.jvm.hotspot.oops.Metadata.instantiateWrapperFor(Metadata.java:68)
    at sun.jvm.hotspot.memory.DictionaryEntry.klass(DictionaryEntry.java:71)
    at sun.jvm.hotspot.memory.Dictionary.classesDo(Dictionary.java:66)
    at sun.jvm.hotspot.memory.SystemDictionary.classesDo(SystemDictionary.java:190)
    at sun.jvm.hotspot.memory.SystemDictionary.allClassesDo(SystemDictionary.java:183)
    at sun.jvm.hotspot.utilities.HeapHprofBinWriter.writeClasses(HeapHprofBinWriter.java:954)
    at sun.jvm.hotspot.utilities.HeapHprofBinWriter.write(HeapHprofBinWriter.java:427)
    at sun.jvm.hotspot.tools.HeapDumper.run(HeapDumper.java:62)
    at sun.jvm.hotspot.tools.Tool.startInternal(Tool.java:260)
    at sun.jvm.hotspot.tools.Tool.start(Tool.java:223)
    at sun.jvm.hotspot.tools.Tool.execute(Tool.java:118)
    at sun.jvm.hotspot.tools.HeapDumper.main(HeapDumper.java:83)
    ... 6 more
I started googling and found this SO post which helped me. Of course, I was running it as the wrong user which caused this issue...
To solve the problem, I re-ran the command like this: sudo -u ecraft jmap -dump:format=b,file=/tmp/heapdump-20170926-0901 7410, which worked flawlessly. Then I transferred the file to my local computer (with scp), and ran jvisualvm. Unfortunately, it refused to open the file. It turned out jvisualvm can only use a full core dump, not a heap dump...
So I tried with jhat instead. Worked much better, now all I had to do was learn yet another new tool. ![]() I also learned that
I also learned that kill -3 <pid> can give you a core dump, but only if specifically instructed to do so. By default, it prints some pretty interesting information to stdout or stderr (a list of all current threads, and some heap data). It looked like this in my case (non-comprehensive form):
Sep 26 06:36:11 microservice-jruby-xxxxxxxxxx yyyyyyyyyyyyyy-backend: JNI global references: 15958
Sep 26 06:36:11 microservice-jruby-xxxxxxxxxx yyyyyyyyyyyyyy-backend:
Sep 26 06:36:11 microservice-jruby-xxxxxxxxxx yyyyyyyyyyyyyy-backend: Heap
Sep 26 06:36:11 microservice-jruby-xxxxxxxxxx yyyyyyyyyyyyyy-backend:  par new generation   total 77440K, used 18221K [0x00000006c5400000, 0x00000006ca800000, 0x00000006eed90000)
Sep 26 06:36:11 microservice-jruby-xxxxxxxxxx yyyyyyyyyyyyyy-backend:   eden space 68864K,  22% used [0x00000006c5400000, 0x00000006c6322050, 0x00000006c9740000)
Sep 26 06:36:11 microservice-jruby-xxxxxxxxxx yyyyyyyyyyyyyy-backend:   from space 8576K,  31% used [0x00000006c9fa0000, 0x00000006ca249518, 0x00000006ca800000)
Sep 26 06:36:11 microservice-jruby-xxxxxxxxxx yyyyyyyyyyyyyy-backend:   to   space 8576K,   0% used [0x00000006c9740000, 0x00000006c9740000, 0x00000006c9fa0000)
Sep 26 06:36:11 microservice-jruby-xxxxxxxxxx yyyyyyyyyyyyyy-backend:  concurrent mark-sweep generation total 274180K, used 193141K [0x00000006eed90000, 0x00000006ff951000, 0x00000007c0000000)
Sep 26 06:36:11 microservice-jruby-xxxxxxxxxx yyyyyyyyyyyyyy-backend:  Metaspace       used 80164K, capacity 109109K, committed 109280K, reserved 1144832K
Sep 26 06:36:11 microservice-jruby-xxxxxxxxxx yyyyyyyyyyyyyy-backend:   class space    used 10442K, capacity 14728K, committed 14816K, reserved 1048576K
Remember, this was now a short period of time after the Java process was started. Here is what the memory usage looked like:
root@microservice-jruby-xxxxxxxxxx:/# ps -ax -o pid,rss | grep 14302
14302 552424
I then gave it some time to run, and got back to see how it was doing. I also discussed with a colleague and heard that Eclipse Memory Analyzer is a quite decent tool for debugging these issues (it was also mentioned in one of the blog posts linked below.)
This is what it looked like after a few days:
root@microservice-jruby-m3prdes201:/# ps -ax -o pid,rss | grep 14302
14302 2297204
It feels like a leak, but more analysis is needed before we know for sure. I took out the SIGQUIT (kill -3) data again, and made a heap dump as well:
Sep 29 05:56:51 microservice-jruby-m3prdes201 deliveryplanner-backend: JNI global references: 57283
Sep 29 05:56:51 microservice-jruby-m3prdes201 deliveryplanner-backend:
Sep 29 05:56:51 microservice-jruby-m3prdes201 deliveryplanner-backend: Heap
Sep 29 05:56:51 microservice-jruby-m3prdes201 deliveryplanner-backend:  par new generation   total 77440K, used 5352K [0x00000006c5400000, 0x00000006ca800000, 0x00000006eed90000)
Sep 29 05:56:51 microservice-jruby-m3prdes201 deliveryplanner-backend:   eden space 68864K,   6% used [0x00000006c5400000, 0x00000006c5889f80, 0x00000006c9740000)
Sep 29 05:56:51 microservice-jruby-m3prdes201 deliveryplanner-backend:   from space 8576K,   8% used [0x00000006c9fa0000, 0x00000006ca050450, 0x00000006ca800000)
Sep 29 05:56:51 microservice-jruby-m3prdes201 deliveryplanner-backend:   to   space 8576K,   0% used [0x00000006c9740000, 0x00000006c9740000, 0x00000006c9fa0000)
Sep 29 05:56:51 microservice-jruby-m3prdes201 deliveryplanner-backend:  concurrent mark-sweep generation total 2141628K, used 1864161K [0x00000006eed90000, 0x00000007718ff000, 0x00000007c0000000)
Sep 29 05:56:51 microservice-jruby-m3prdes201 deliveryplanner-backend:  Metaspace       used 98653K, capacity 149726K, committed 149936K, reserved 1181696K
Sep 29 05:56:51 microservice-jruby-m3prdes201 deliveryplanner-backend:   class space    used 11473K, capacity 17531K, committed 17612K, reserved 1048576K
We were now close to the weekend, so we restarted preventively.
Using Eclipse Memory Analyzer Tool to further dig into the issue
Then, I opened the heap dump in MAT a few days later. Since the heap dump was 2 GiB this time, it took a bit of time for MAT to open and analyze it. Unfortunately, it eventually ran into an error:
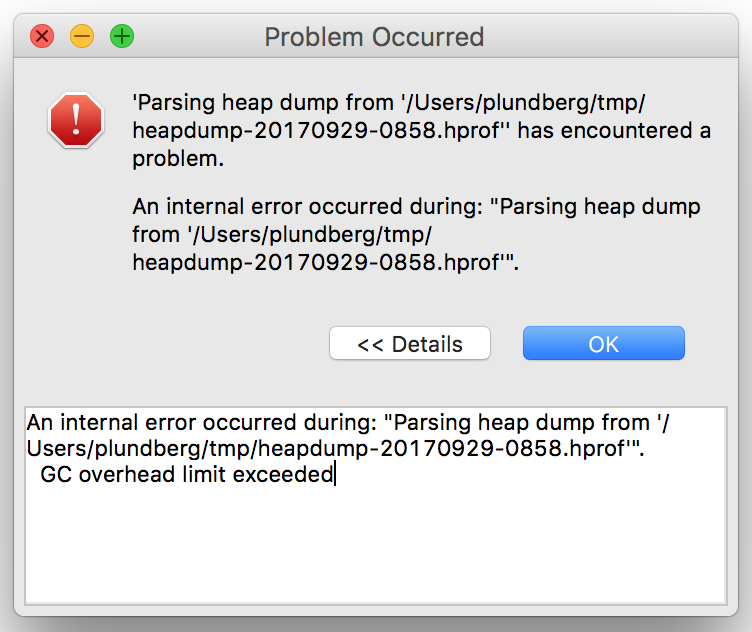
By googling I found this StackOverflow post, which led me to tweak MemoryAnalyzer.ini like below, and then restart MAT and reopen the file. (The default was to max out at 1024 MiB, which was obviously too little to be able to load a file of this size.)
-startup
../Eclipse/plugins/org.eclipse.equinox.launcher_1.3.100.v20150511-1540.jar
--launcher.library
../Eclipse/plugins/org.eclipse.equinox.launcher.cocoa.macosx.x86_64_1.1.300.v20150602-1417
-vmargs
-Xms1024m
-Xmx4096m
-Dorg.eclipse.swt.internal.carbon.smallFonts
-XstartOnFirstThread
It actually felt a bit faster this time, perhaps because the JVM now had a bigger maximum heap size to play with.
When the file was done opening, I went straight to the "leak suspects report". Maybe it would give me a hint of the right direction?
jruby.org.MetaClass: our prime suspect
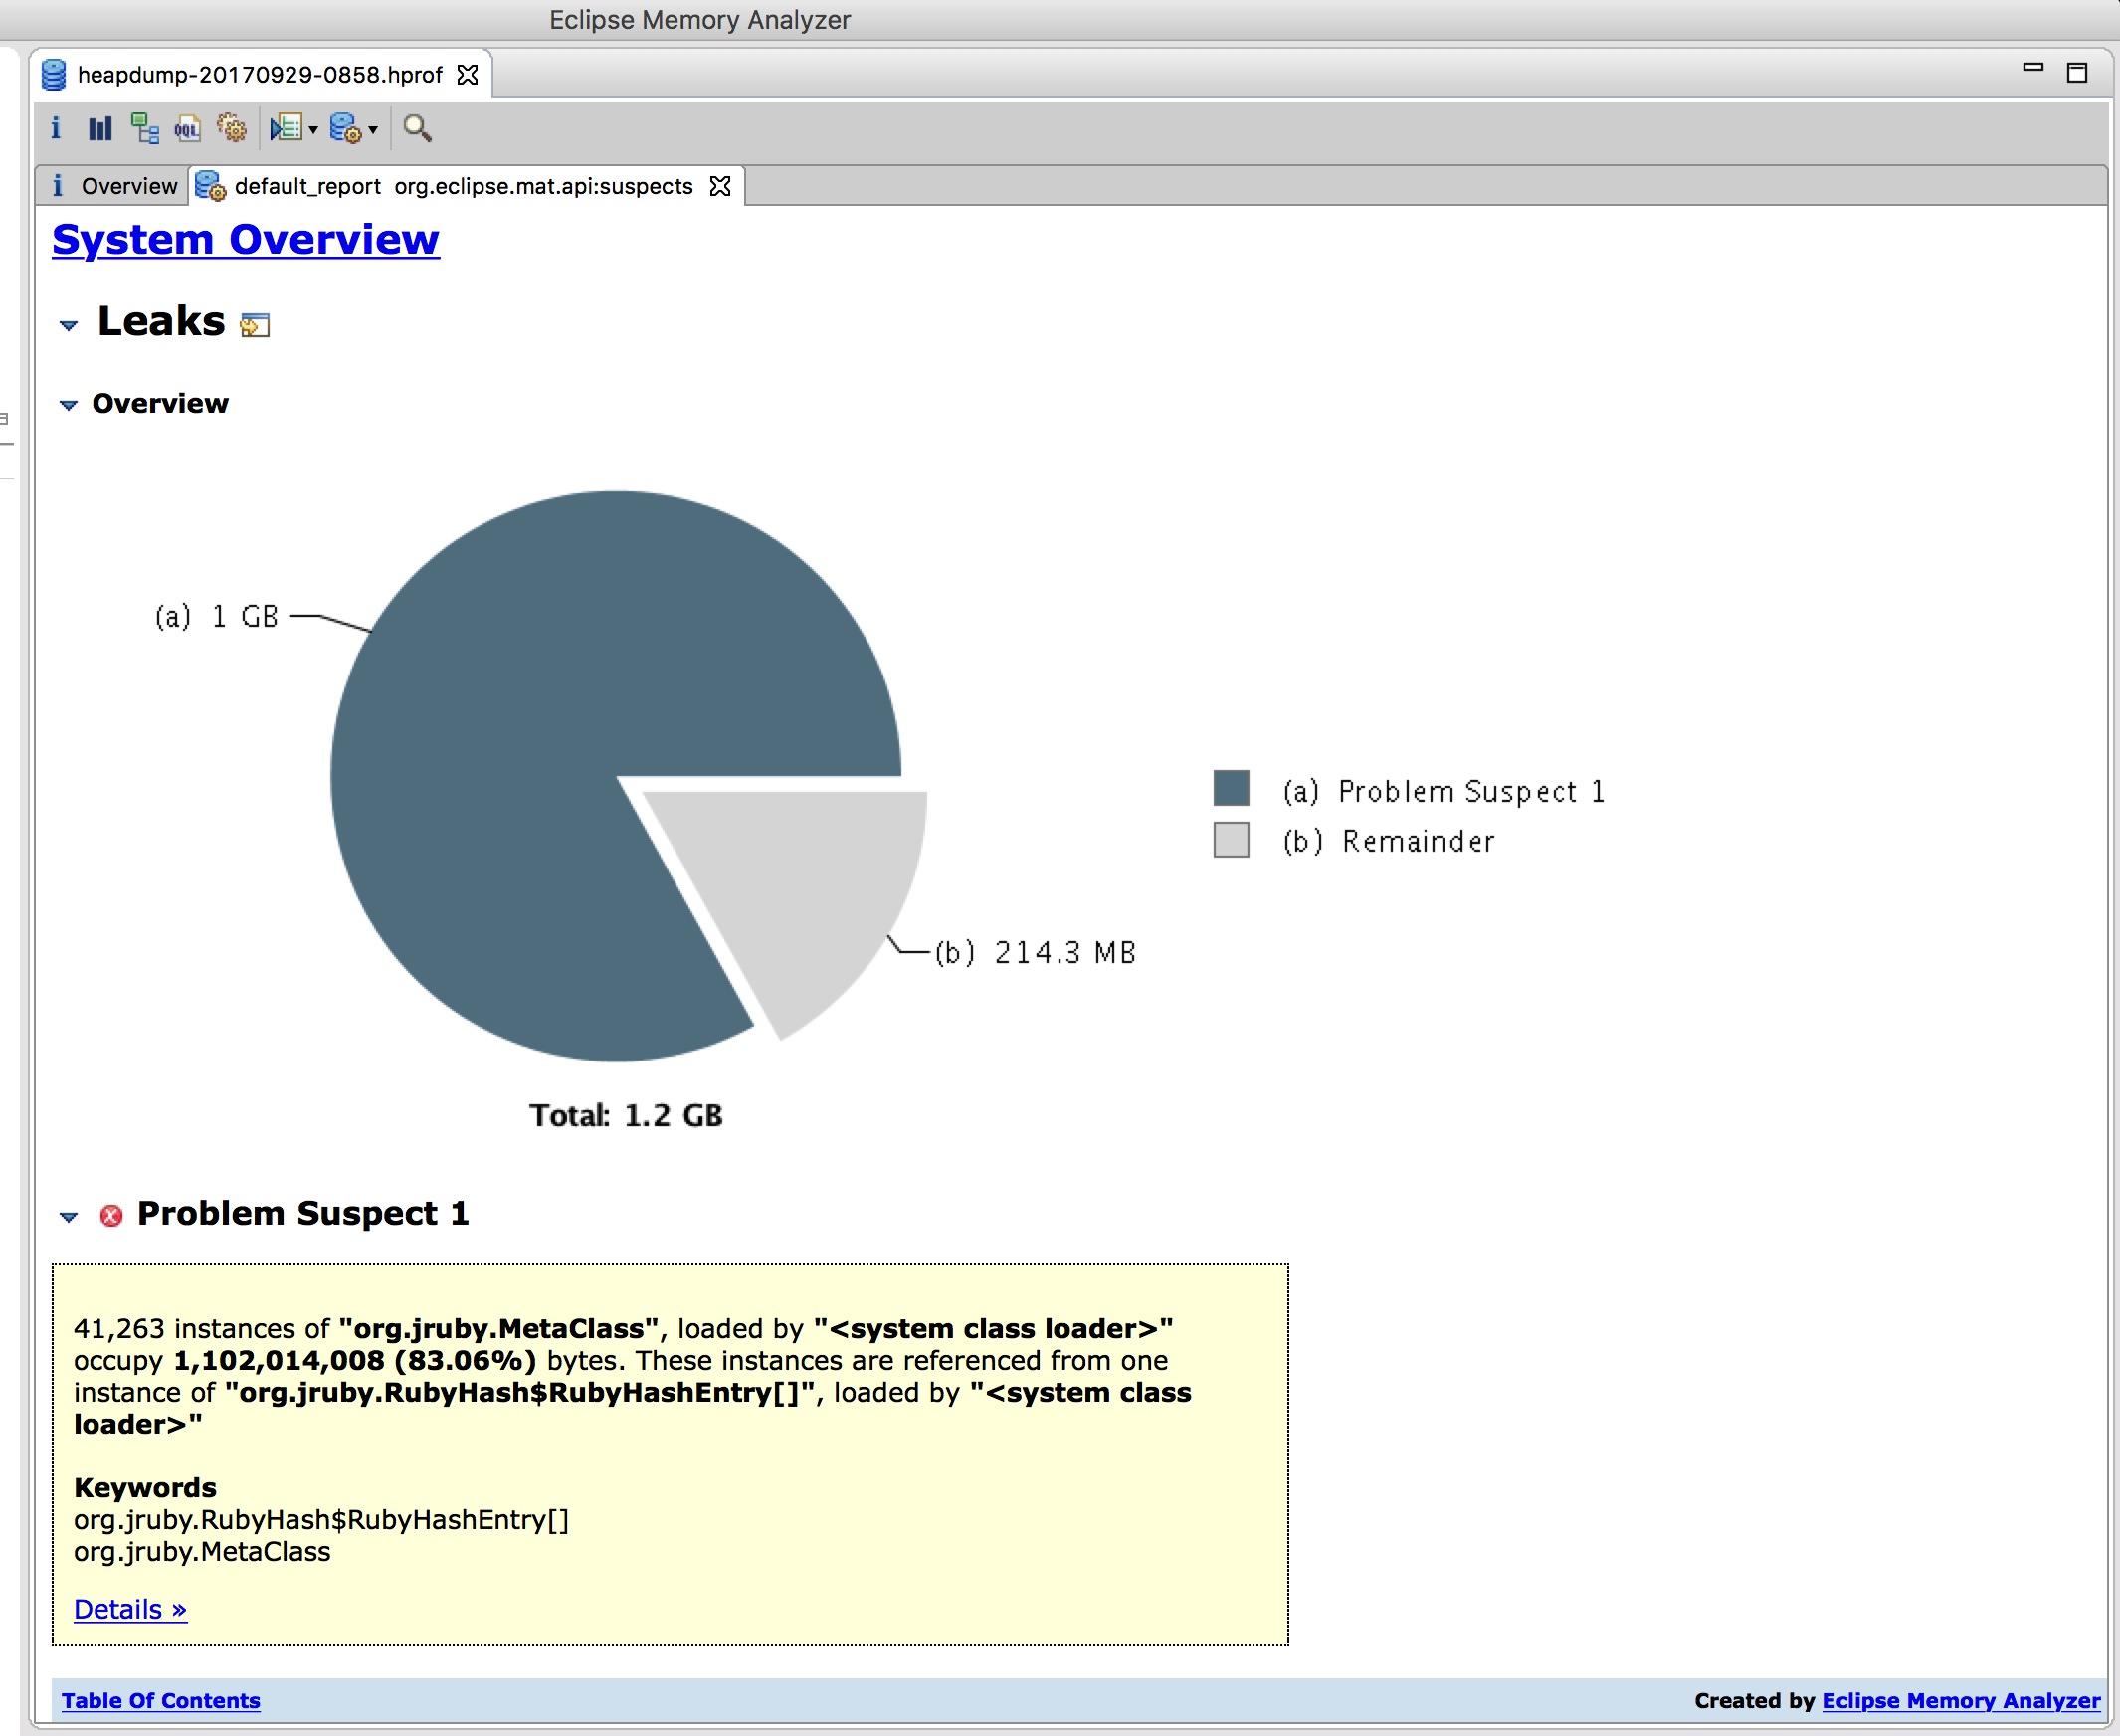
One gigabyte of MetaClass instances, that's quite a lot indeed. Metaclass does not seem to be a very big and complex class itself, but its parent class is RubyClass which is a much longer class.
Then I looked at the histogram:
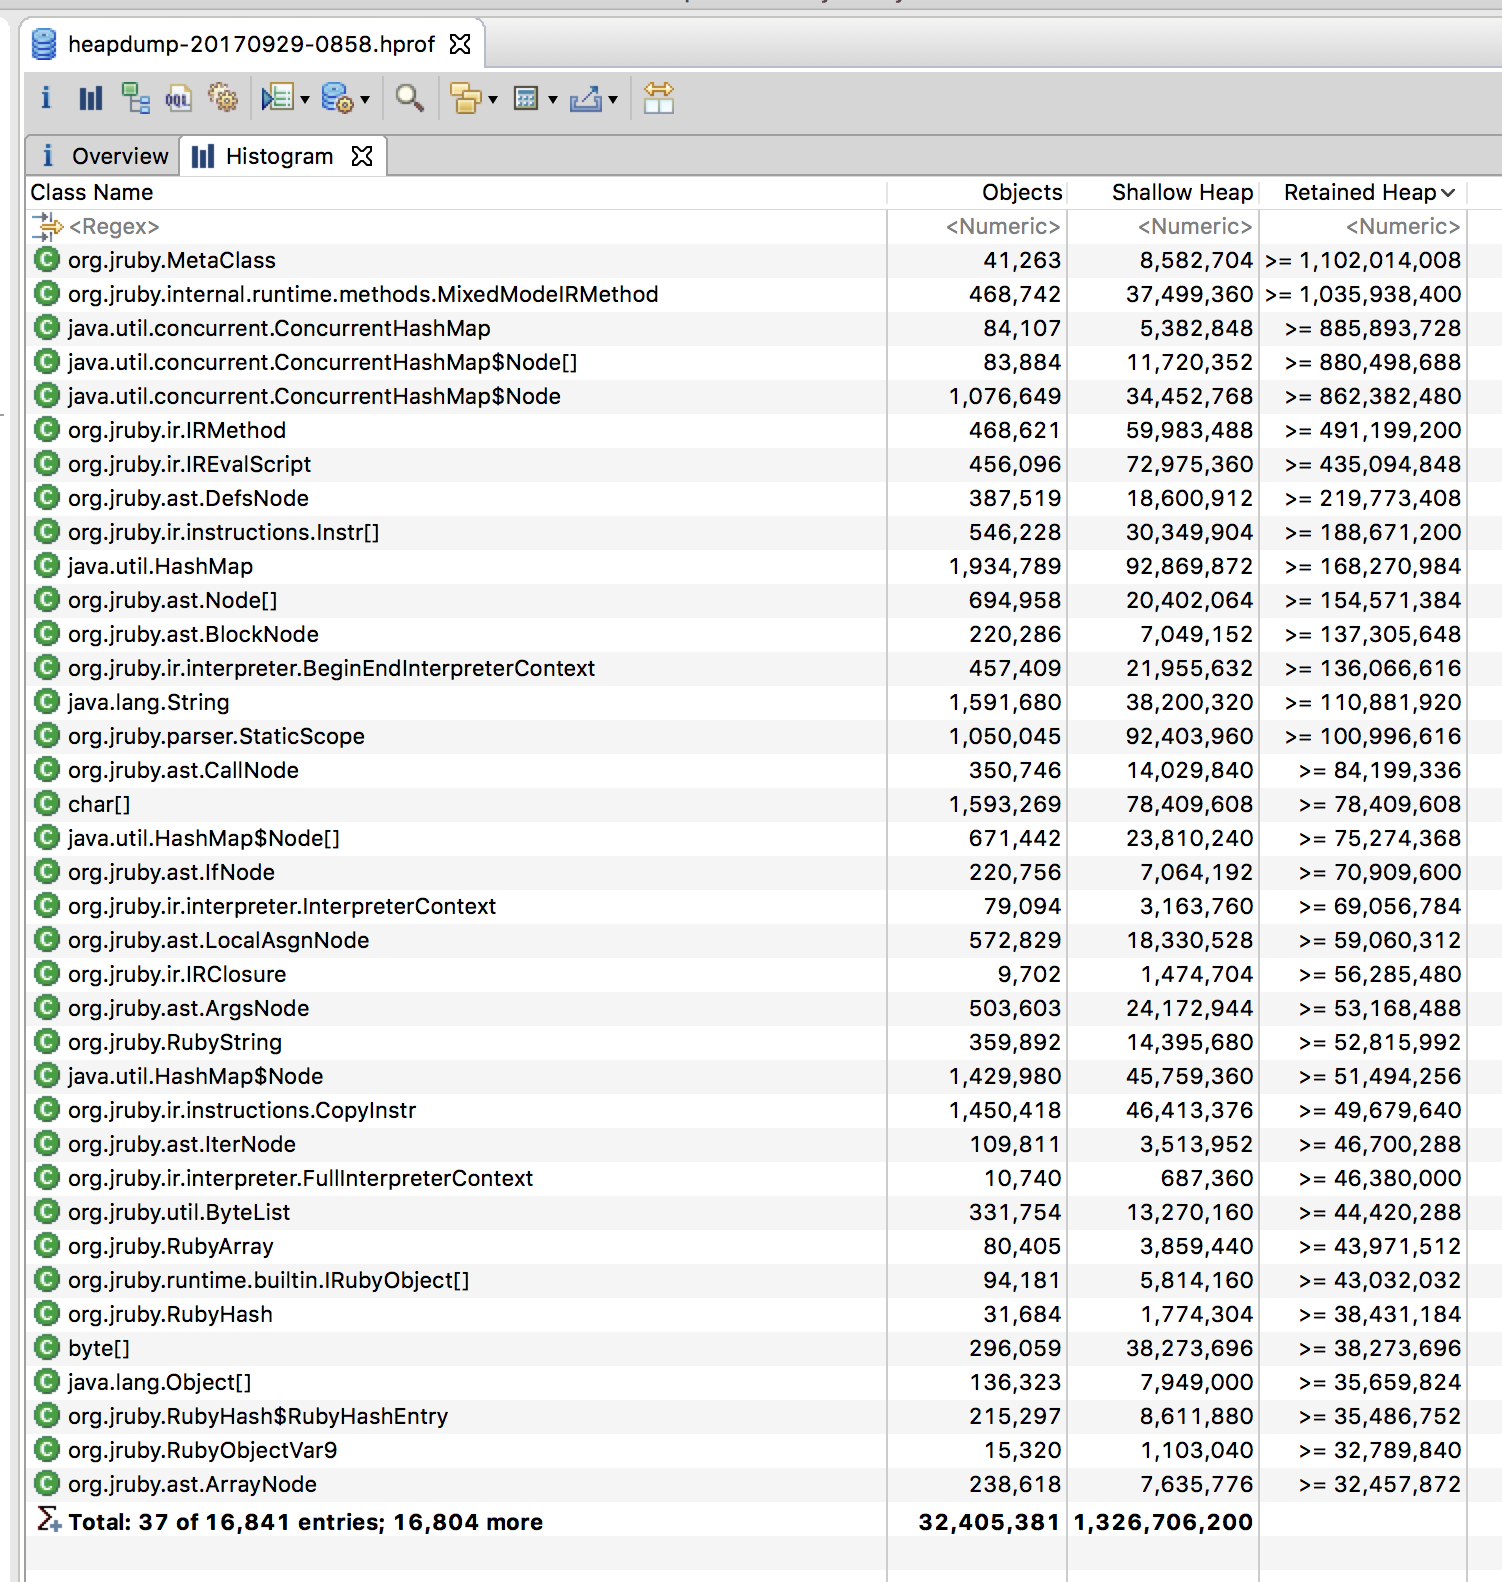
The histogram above also shows the same picture basically. 40 000 Ruby MetaClass instances, with a total of 468 000 IR methods. What are these methods, more specifically? I mean - if I group these methods by name, what names are the most common ones? Let's try and find that out!
In the process of doing this, I learned that Eclipse MAT has an interesting thing called the OQL (Object Query Language?), which is essentially an SQL-like language which you can use to query the heap dump for data. Very interesting indeed! Unfortunately, I didn't yet manage to do any GROUP BY queries with it, which would super cool since I could then see more specifically what methods are most commonly being defined.
Here was one of my initial OQL queries by the way:
SELECT realClass.baseName.toString() FROM org.jruby.MetaClass
I found out that there was a way to workaround this: by exporting the results to CSV, I could then just pipe it via some neat Unix utilities and get a grouped view:
$ cat meta_class_base_names.csv | sort | uniq -c | sort -n -r
37852 Logger,
2527 Class,
 436 Module,
 239 PatternFormatter,
 133 ConnectionOptions,
  36 JavaPackage,
  11 Function,
   5 Object,
   5 ExternalRuntime,
   5 Cell,
   1 realClass.baseName.toString(),
   1 ThreadedConnectionPool,
   1 String,
   1 StdoutOutputter,
   1 RootLogger,
   1 Resources,
   1 Resolv,
   1 Proc,
   1 Hash,
   1 FeatureFlag,
   1 Database,
   1 Cors,
   1 Configuration,
   1 Command,
   1 Array,
Almost 40000 Logger classes. That's clearly not reasonable. The number of Class instances is high, perhaps even to the point of unreasonable, but there's more than 10 times more Logger classes, so let's focus on these for starters.
Finding the root cause and final conclusions
The obvious next question then is, of course: why do we have such an enormous amount of Logger classes being defined? I looked more in the JRuby source code and found out that the cachedName property would probably give us an even better name. Let's re-run the query above like this:
SELECT realClass.cachedName.toString() FROM org.jruby.MetaClass
$ cat real_class_cached_name.csv | sort | uniq -c | sort -n -r
37852 Log4r::Logger,
2527 Class,
 436 Module,
 239 Log4r::PatternFormatter,
 133 Faraday::ConnectionOptions,
  36 Java::JavaPackage,
  11 FFI::Function,
   5 Object,
   5 ExecJS::ExternalRuntime,
   5 Celluloid::Proxy::Cell,
   1 realClass.cachedName.toString(),
   1 String,
   1 Sequel::ThreadedConnectionPool,
   1 Sequel::JDBC::Database,
   1 Resolv,
   1 Rack::Cors::Resources,
   1 Rack::Cors,
   1 Proc,
   1 Log4r::StdoutOutputter,
   1 Log4r::RootLogger,
   1 Hash,
   1 Celluloid::Supervision::Configuration,
   1 Bundler::Thor::Command,
   1 Bundler::FeatureFlag,
   1 Array,
Alright - I think we have the root cause found here. log4r seems to be used in our application and/or framework in such a way that it creates a huge number of classes, eventually bringing the system down on its knees. I don't think it's really log4r's fault; it's more likely we use it in a way that it was not designed for, causing huge amounts of memory leaking.
But this was strange. I know that we did, a few months ago, move away from log4r to use our home-weaved logging_library instead. It does not use log4r under the hood, since log4r is more-or-less abandoned upstream. I digged into the Gemfile.lock of my application and looked to see where the log4r dependency was coming from.
Ah. I see it now... This application uses a somewhat older version of the application server, where we hadn't yet gotten rid of log4r. ![]() There is actually an open pull request to upgrade it, we just haven't had time to test that thoroughly enough to be able to ship it to the customer. So, we will focus on getting that PR merged and deployed now ASAP, and check if that makes the leak go away permanently. If not, I will undoubtedly let you know...
There is actually an open pull request to upgrade it, we just haven't had time to test that thoroughly enough to be able to ship it to the customer. So, we will focus on getting that PR merged and deployed now ASAP, and check if that makes the leak go away permanently. If not, I will undoubtedly let you know...
As always, thanks for reading! I hope it helped you to get ideas and inspiration for when you have to debug similar issues yourself.