chaos: Why is the boot server unable to read the startup script?
Alright, I think it's about time to now to once and for all solve the problem with the boot server being unable to read the startup script from the file system. This has been broken for a while and I now intend to solve this bug.
(Warning: as can be seen in the "read time" above, this is a long blog post. It is the result of a debug session that spanned over several nights, spread over multiple weeks, and the whole thing took much, much longer to complete than I had hoped or anticipated. Be forewarned; this will probably take some time to read if you read it all. I was thinking of splitting it up into multiple posts, but I decided not to do it for now; it all forms a continuum in a sense.)
The current state when booting
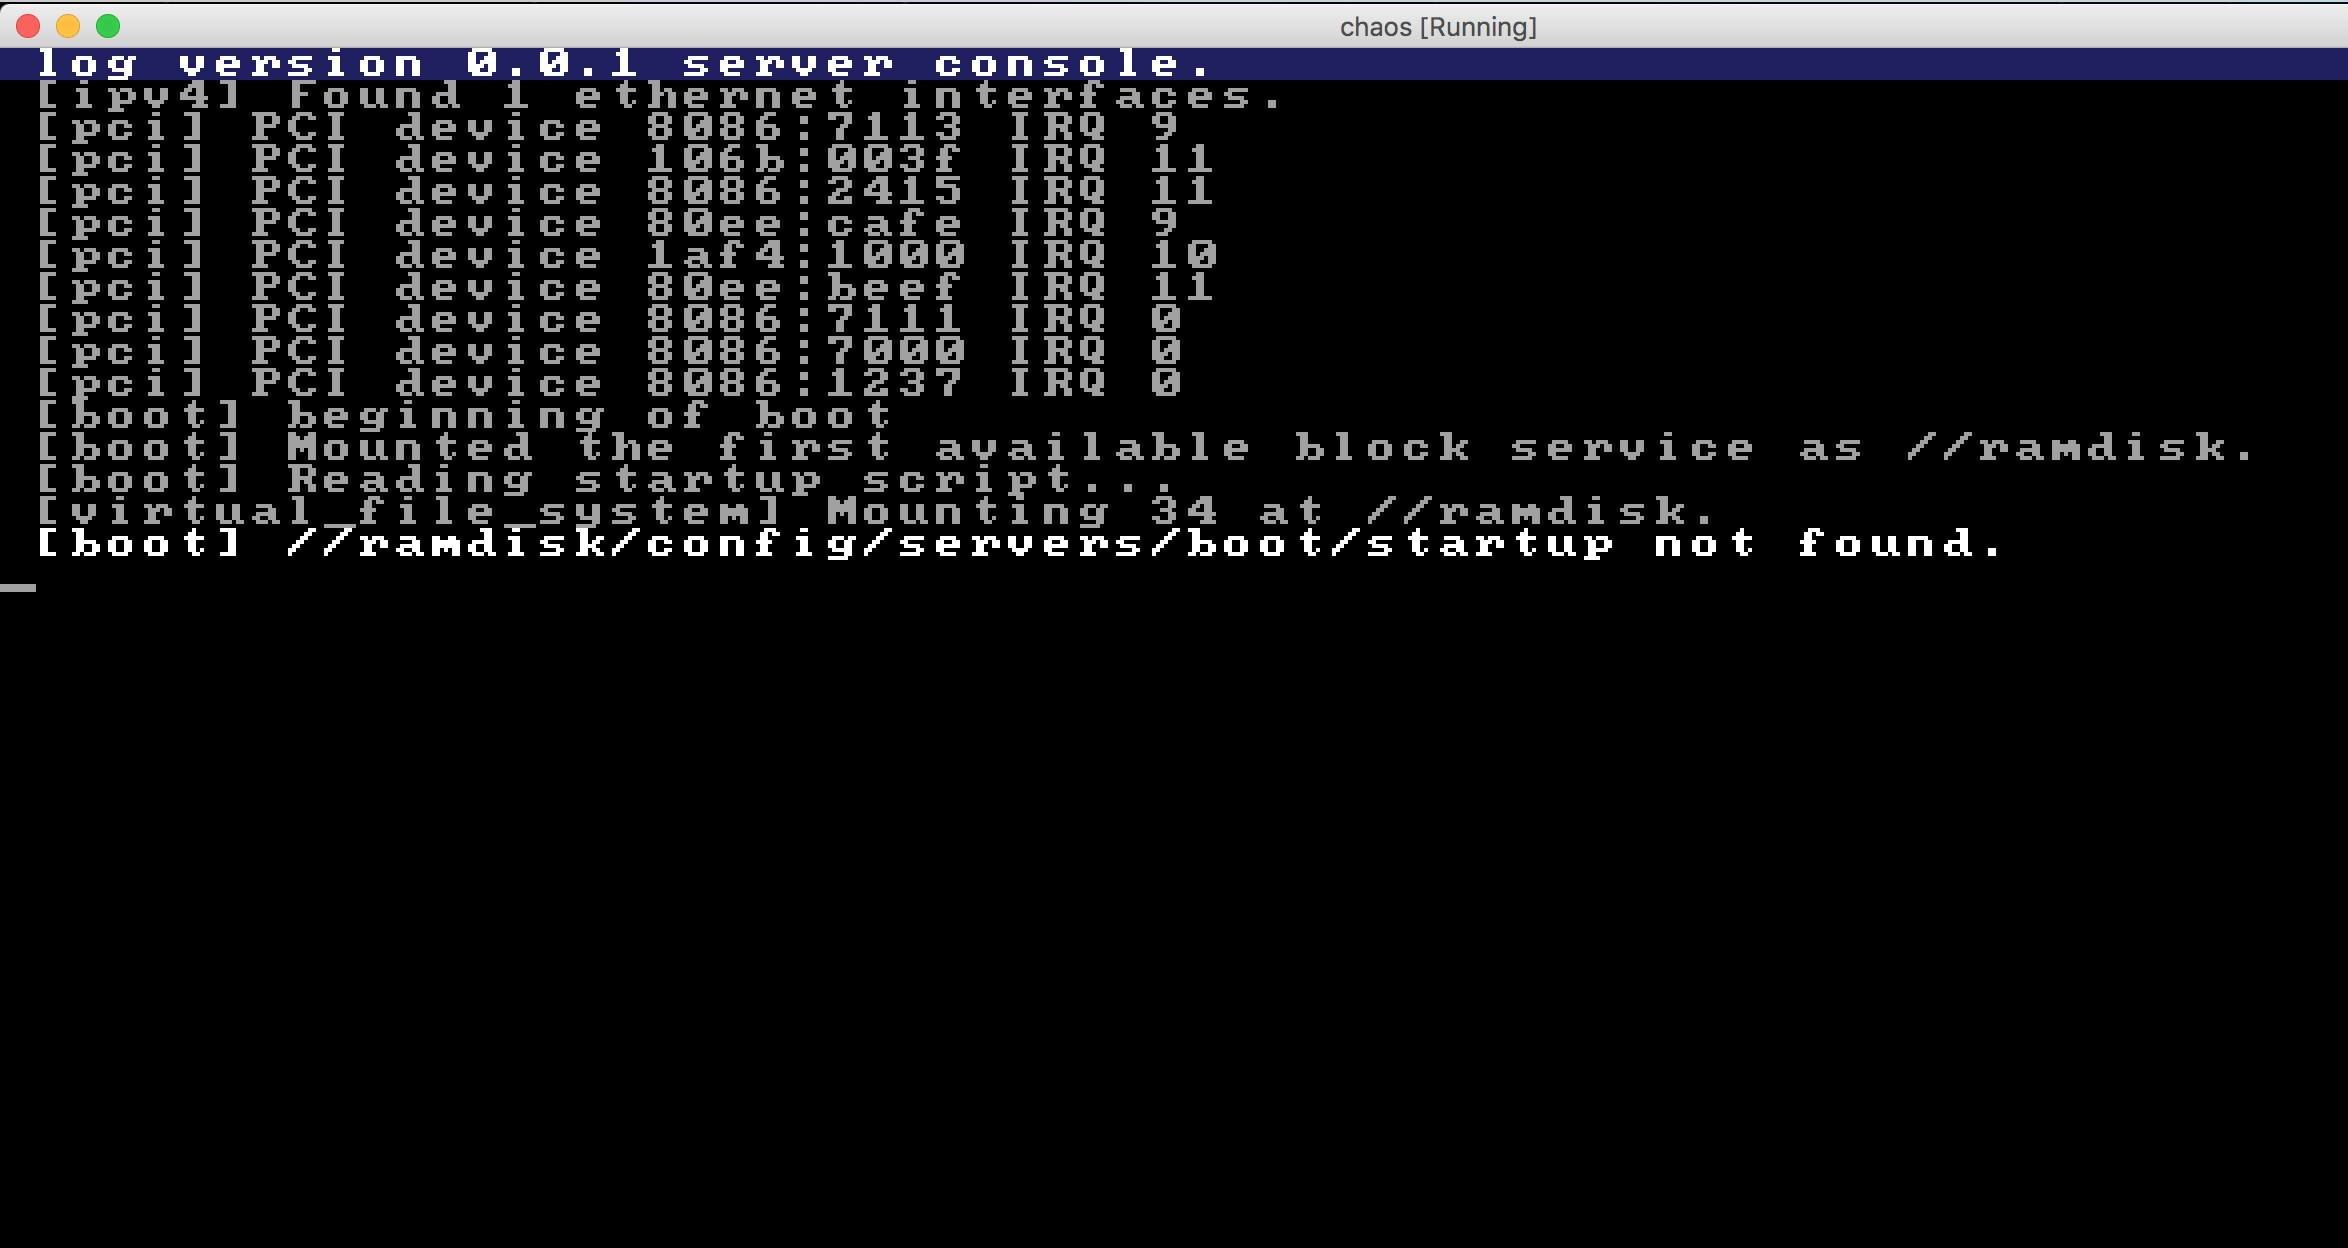
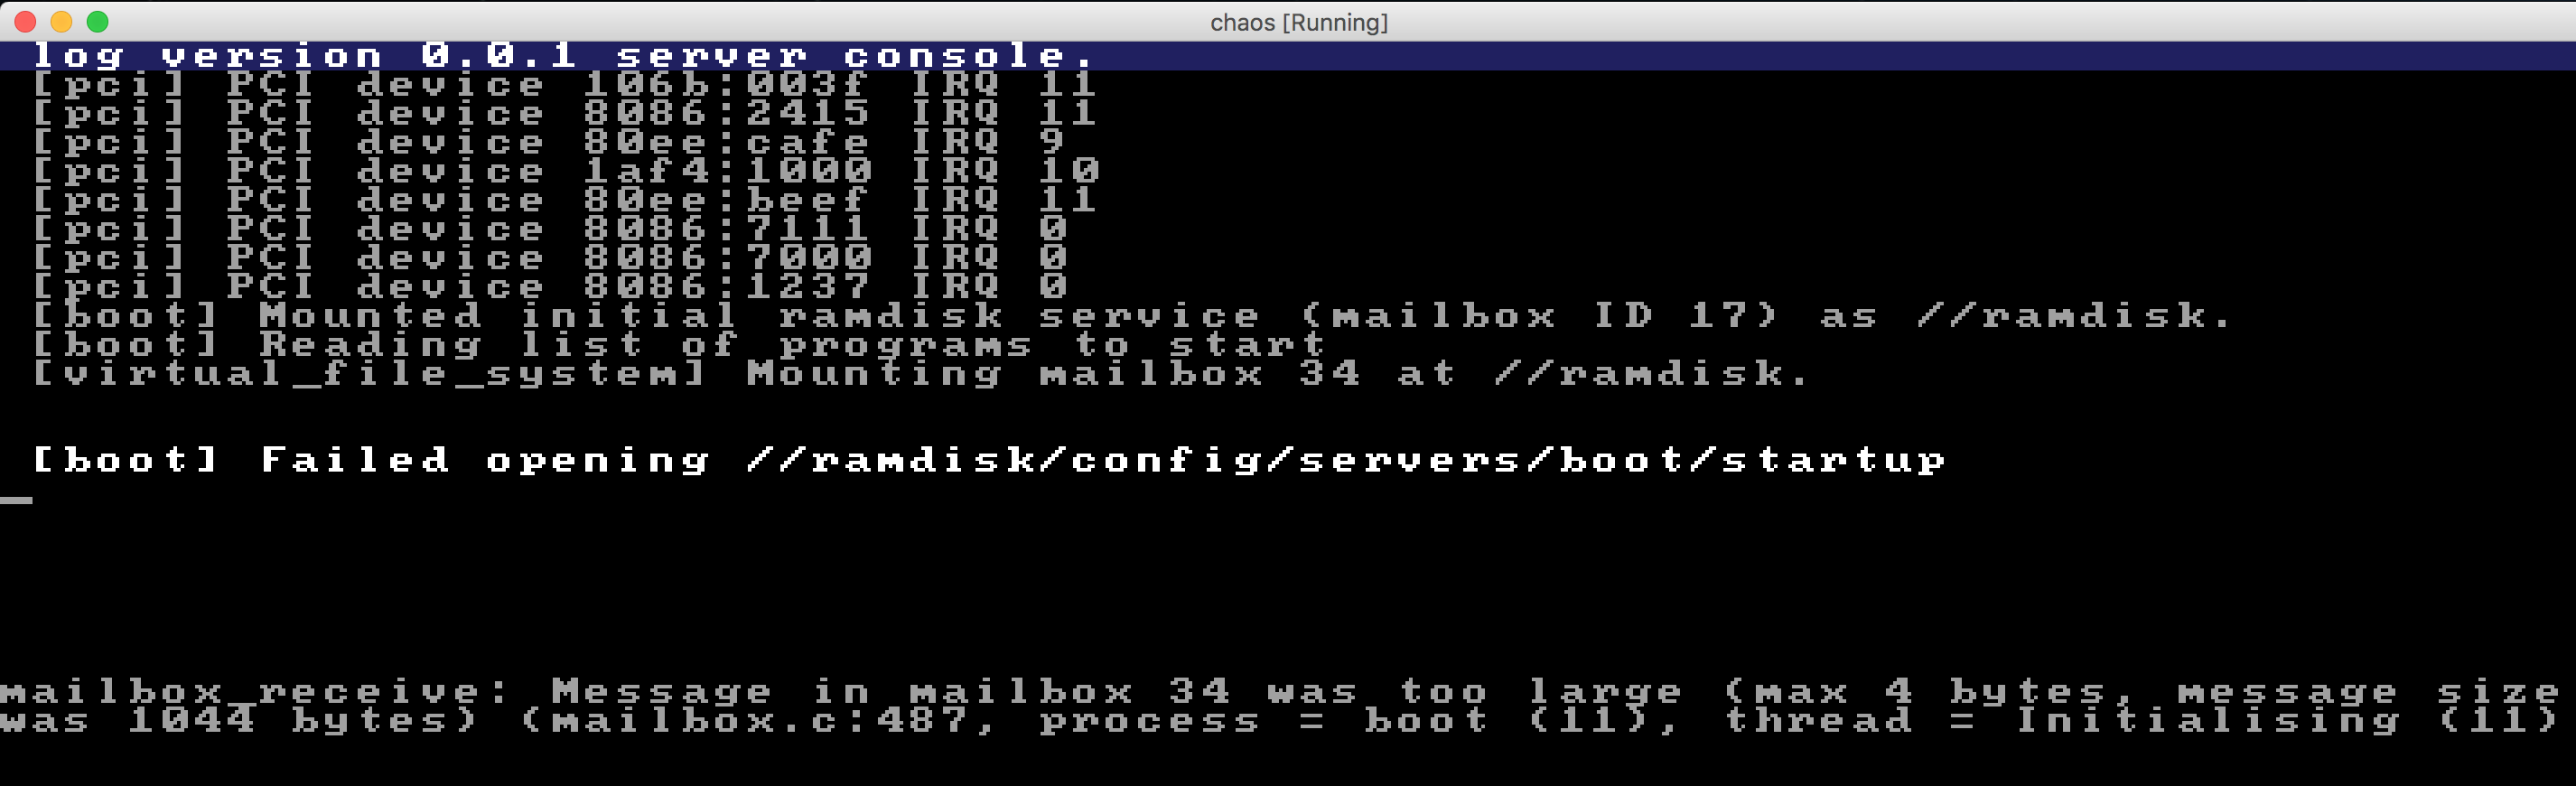
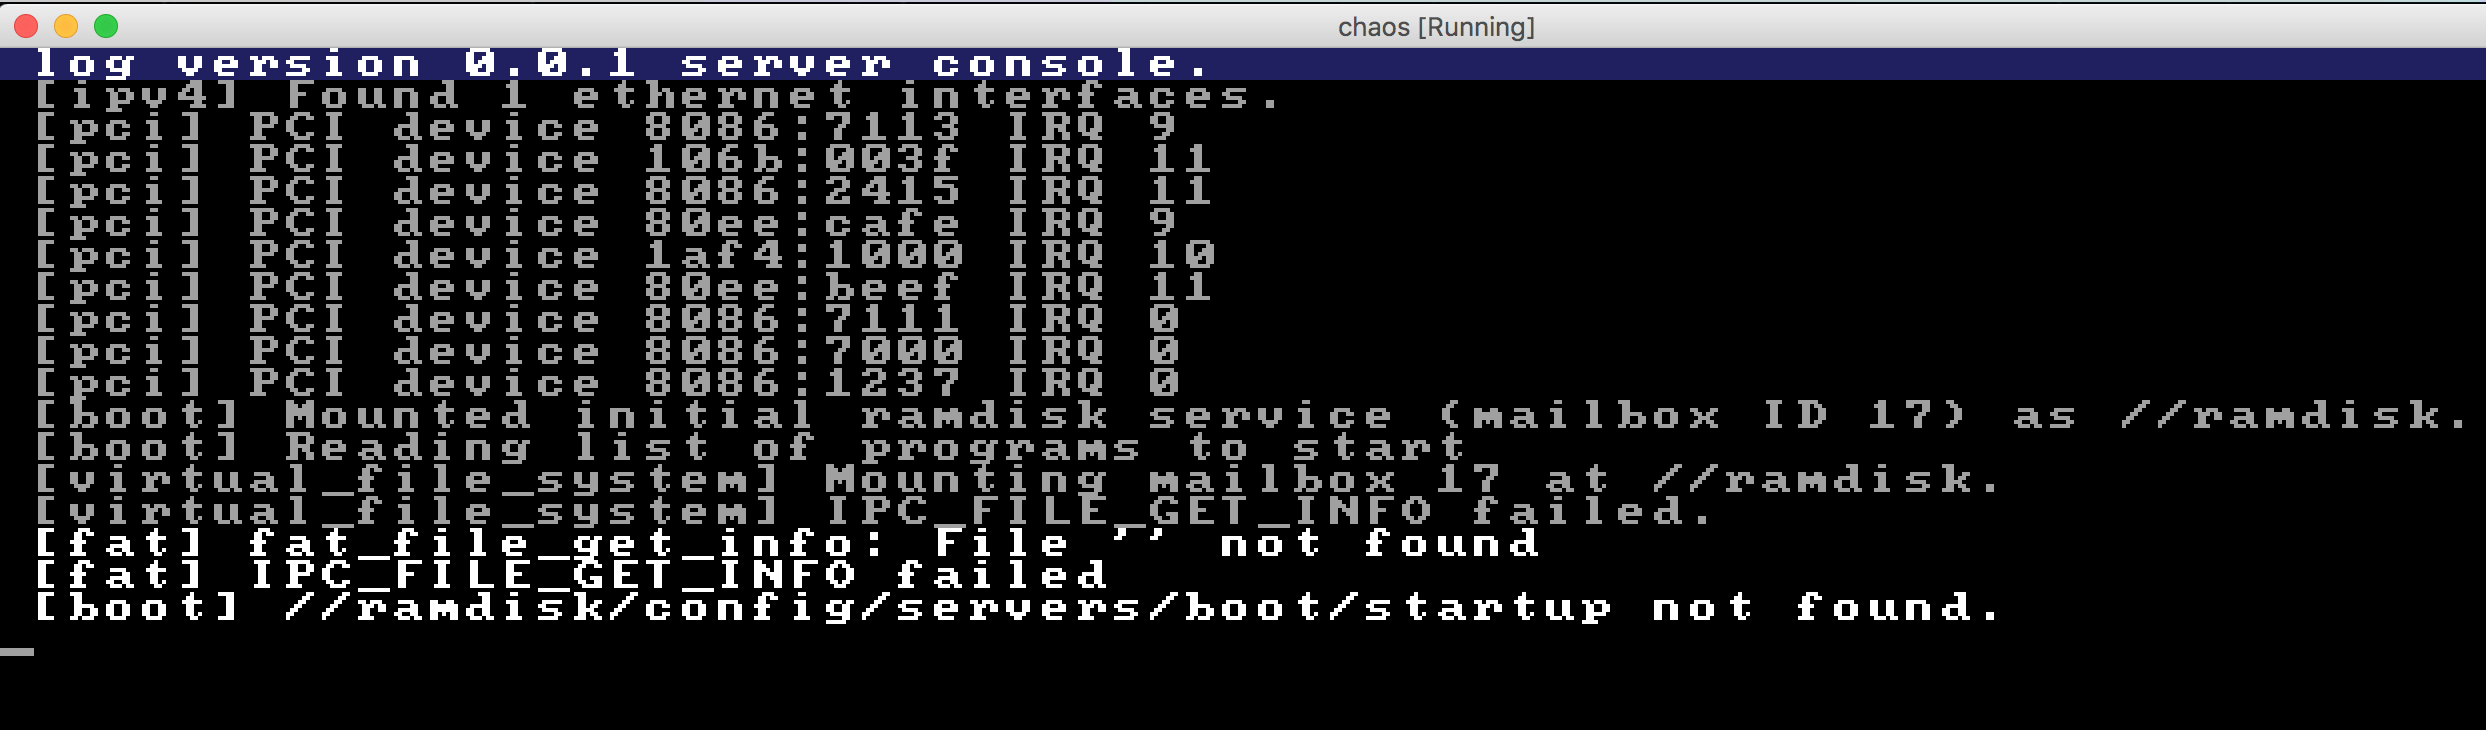
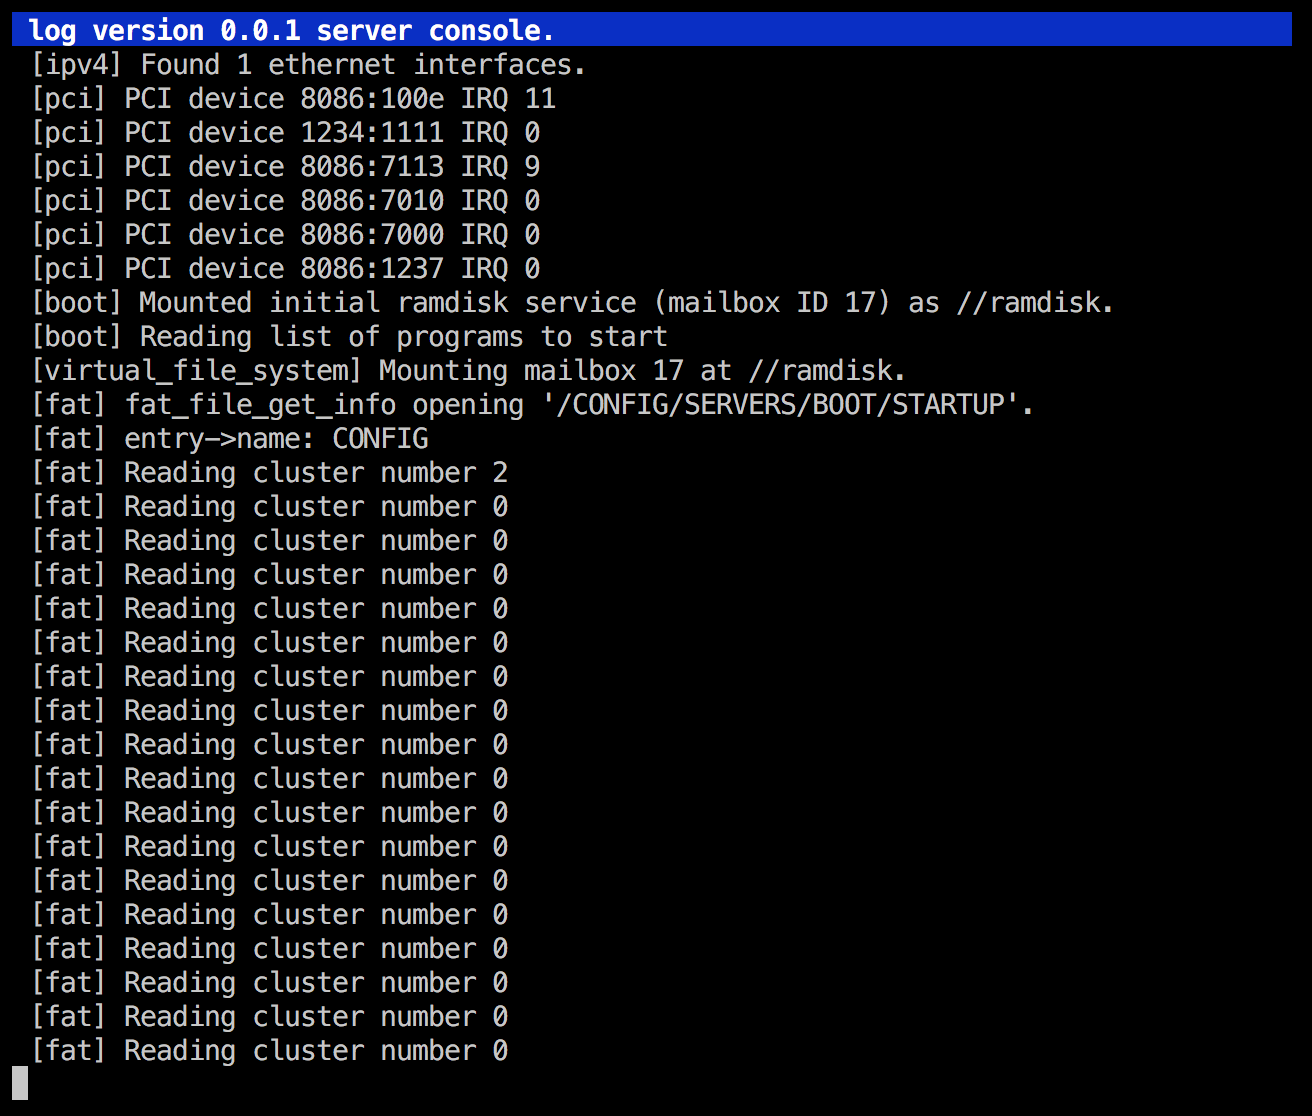
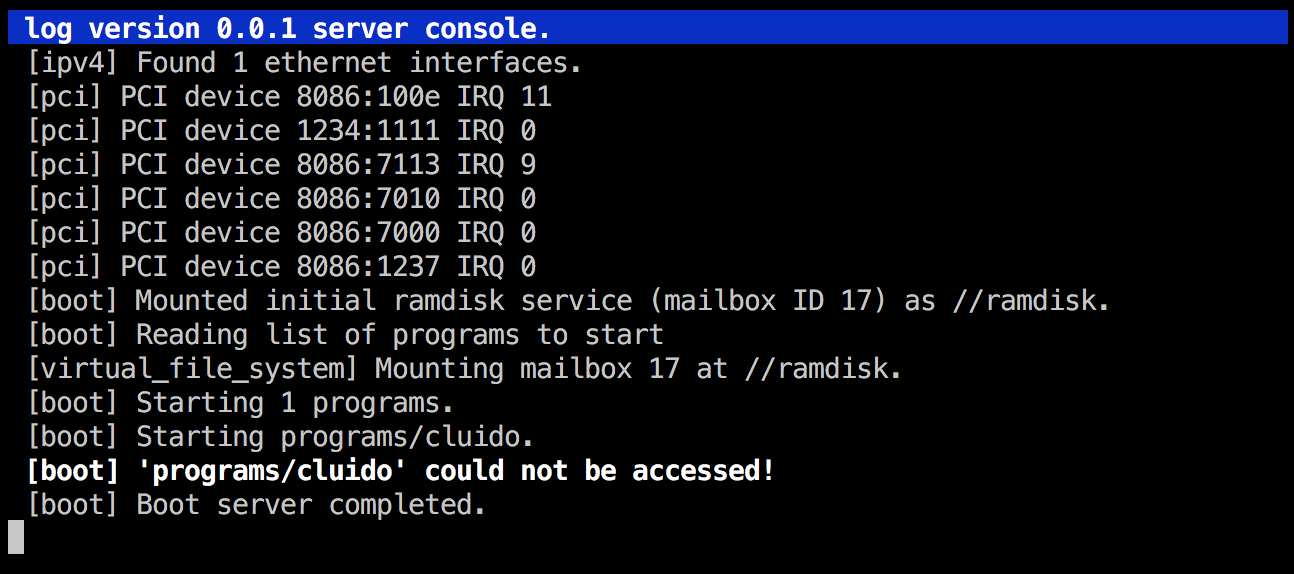
At the moment, here is what the system looks like on startup:
If it was working correctly, this is what it should look like:
- First, the boot server resolves the first available block device. This is supposed to be the initial_ramdisk server.
- It then tells the virtual_file_system server to mount this device as
//ramdisk. - After that, it opens and reads a file named
//ramdisk/config/servers/boot/startup. It parses this file and treats its content as a list of absolute server paths, one path per line. - It loops over the newly parsed list of servers and starts these servers (loading them from the file system and executing the ELF binaries), one by one.
Right now, the first few steps succeed, but when it tries to open the file, it fails miserably, as can be seen above.
We will now look deeply into this issue, but I think at the same time, we should do a bit of a cleanup of the boot server code. As we saw in a previous post, it is rather convoluted so we should refactor it to make it more readable. Many of you who know me from before know that this is actually something I enjoy quite a lot: taking an old, messed up piece of code, and making it shiny, pretty and clean. "Cleaning up the mess" is a task that feels very rewarding to me, and it's a natural application of the boy scout rule - a philosophy regarding software engineering which I believe in very strongly. It simply feels good to leave things in a better state than they were before.
Step one: Refactoring the boot server
So I started doing that. I did a a bunch of changes, trying to find an overall better structure with a main method that looked like this:
int main(void)
{
    set_process_and_thread_name();

    if (!resolve_log_service())
    {
        return -1;
    }

    if (!resolve_vfs_service())
    {
        return -1;
    }

    mailbox_id_type initial_ramdisk_id;
    if (!resolve_initial_ramdisk_service(&initial_ramdisk_id))
    {
        return -1;
    }

    mount_initial_ramdisk(initial_ramdisk_id);

    unsigned int file_size;
    if (!read_program_list(&file_size))
    {
        return -1;
    }

    unsigned int number_of_programs = parse_program_list(file_size);
    log_print_formatted(&log_structure, LOG_URGENCY_DEBUG, "Starting %u programs.", number_of_programs);
    start_programs(number_of_programs);

    system_call_process_parent_unblock();

    log_print(&log_structure, LOG_URGENCY_DEBUG, "end of boot");

    return 0;
}
Much better and more readable than it previously looked, if you ask me.
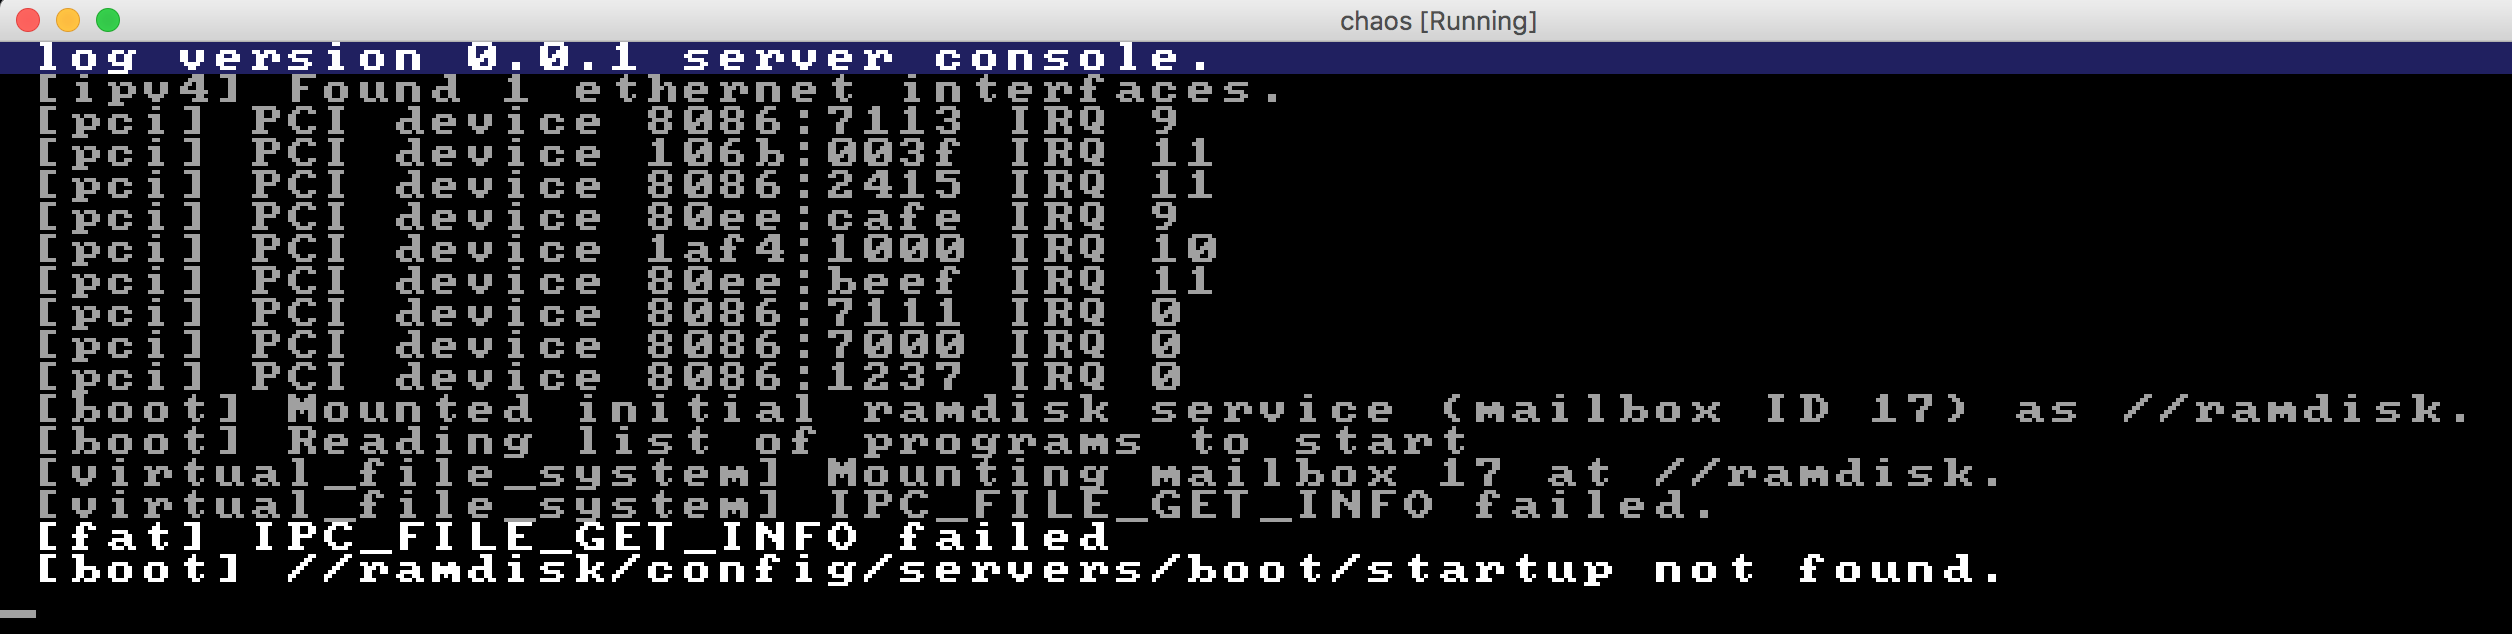
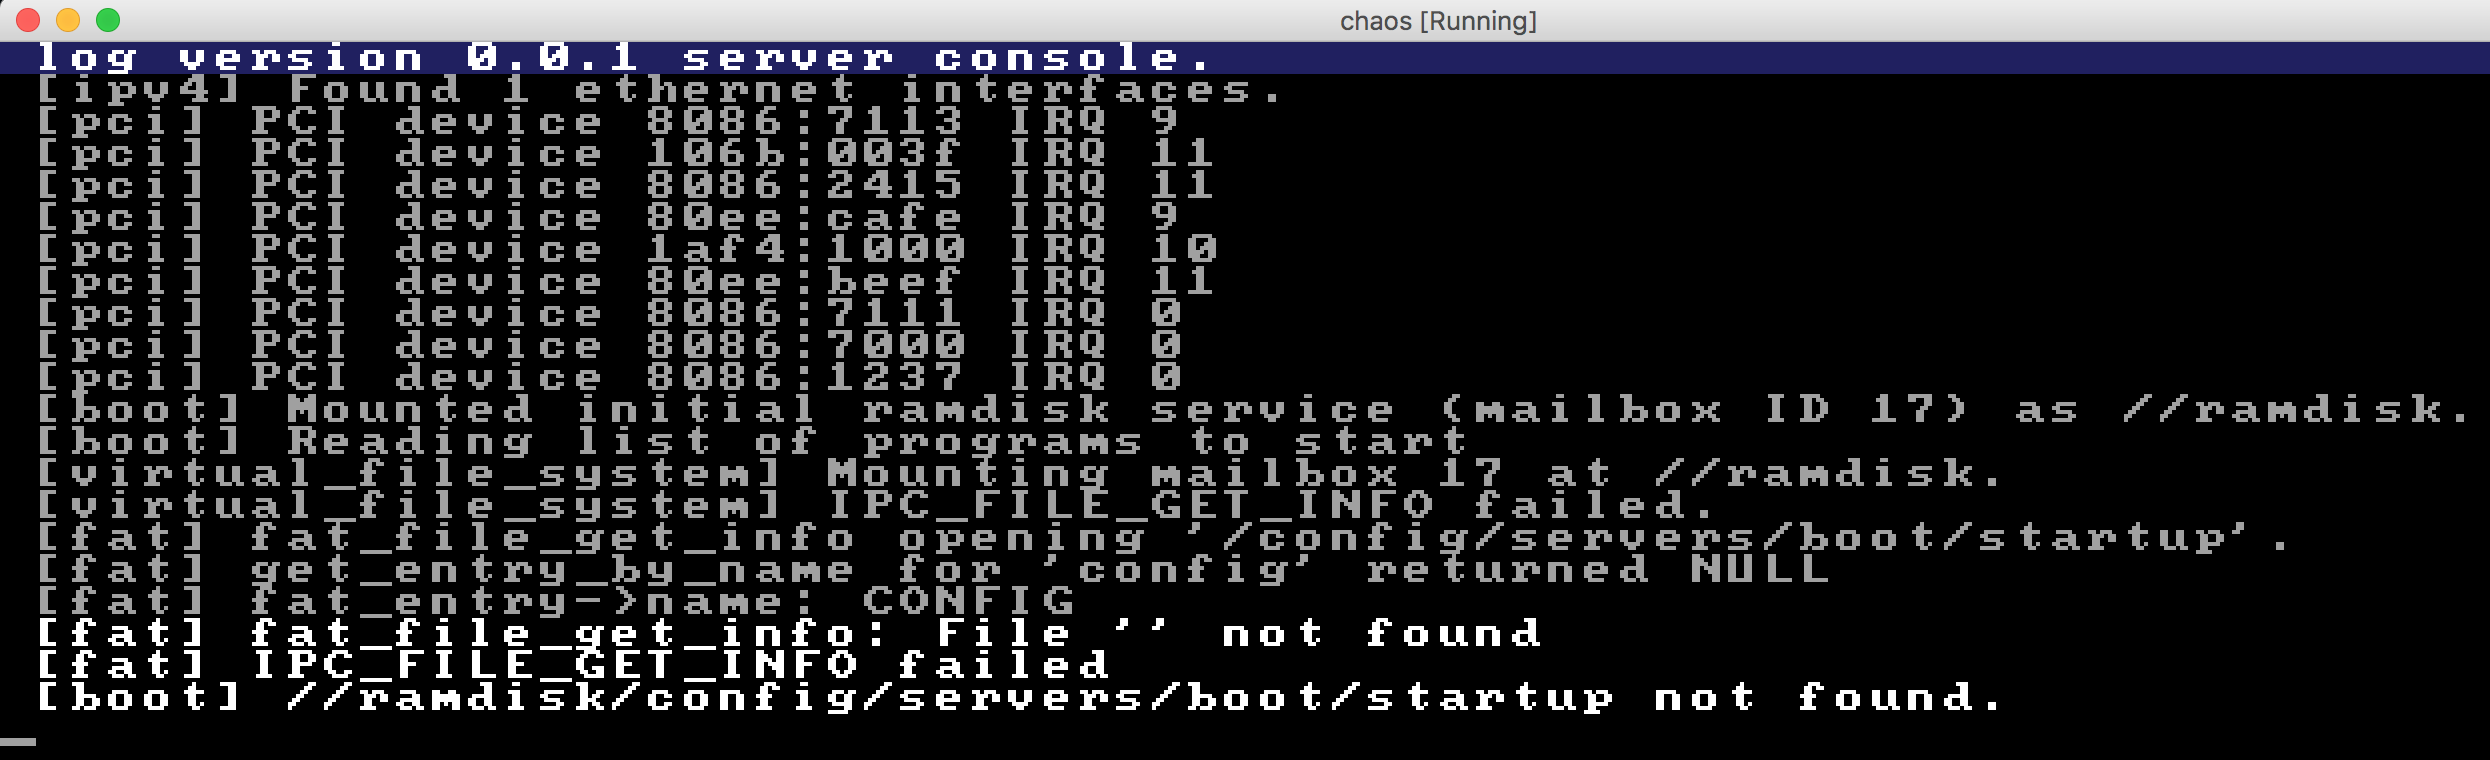
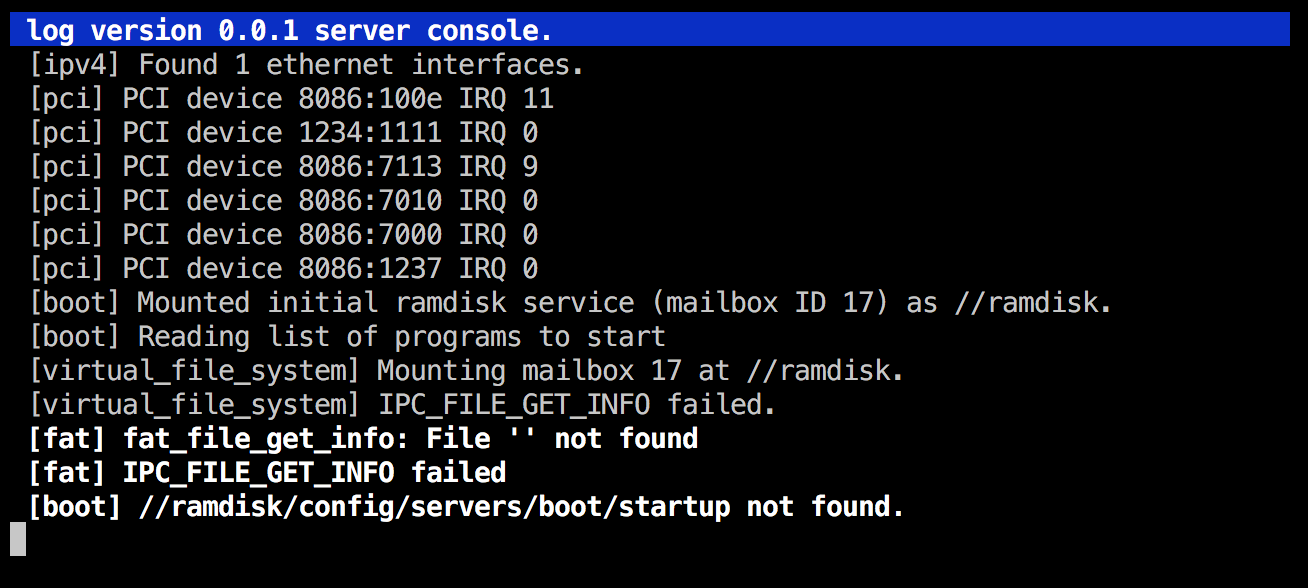
There was only one, slight problem... It now behaved completely differently on startup. Instead of the previous //ramdisk/config/servers/boot/startup not found message seen above, I now got this instead:
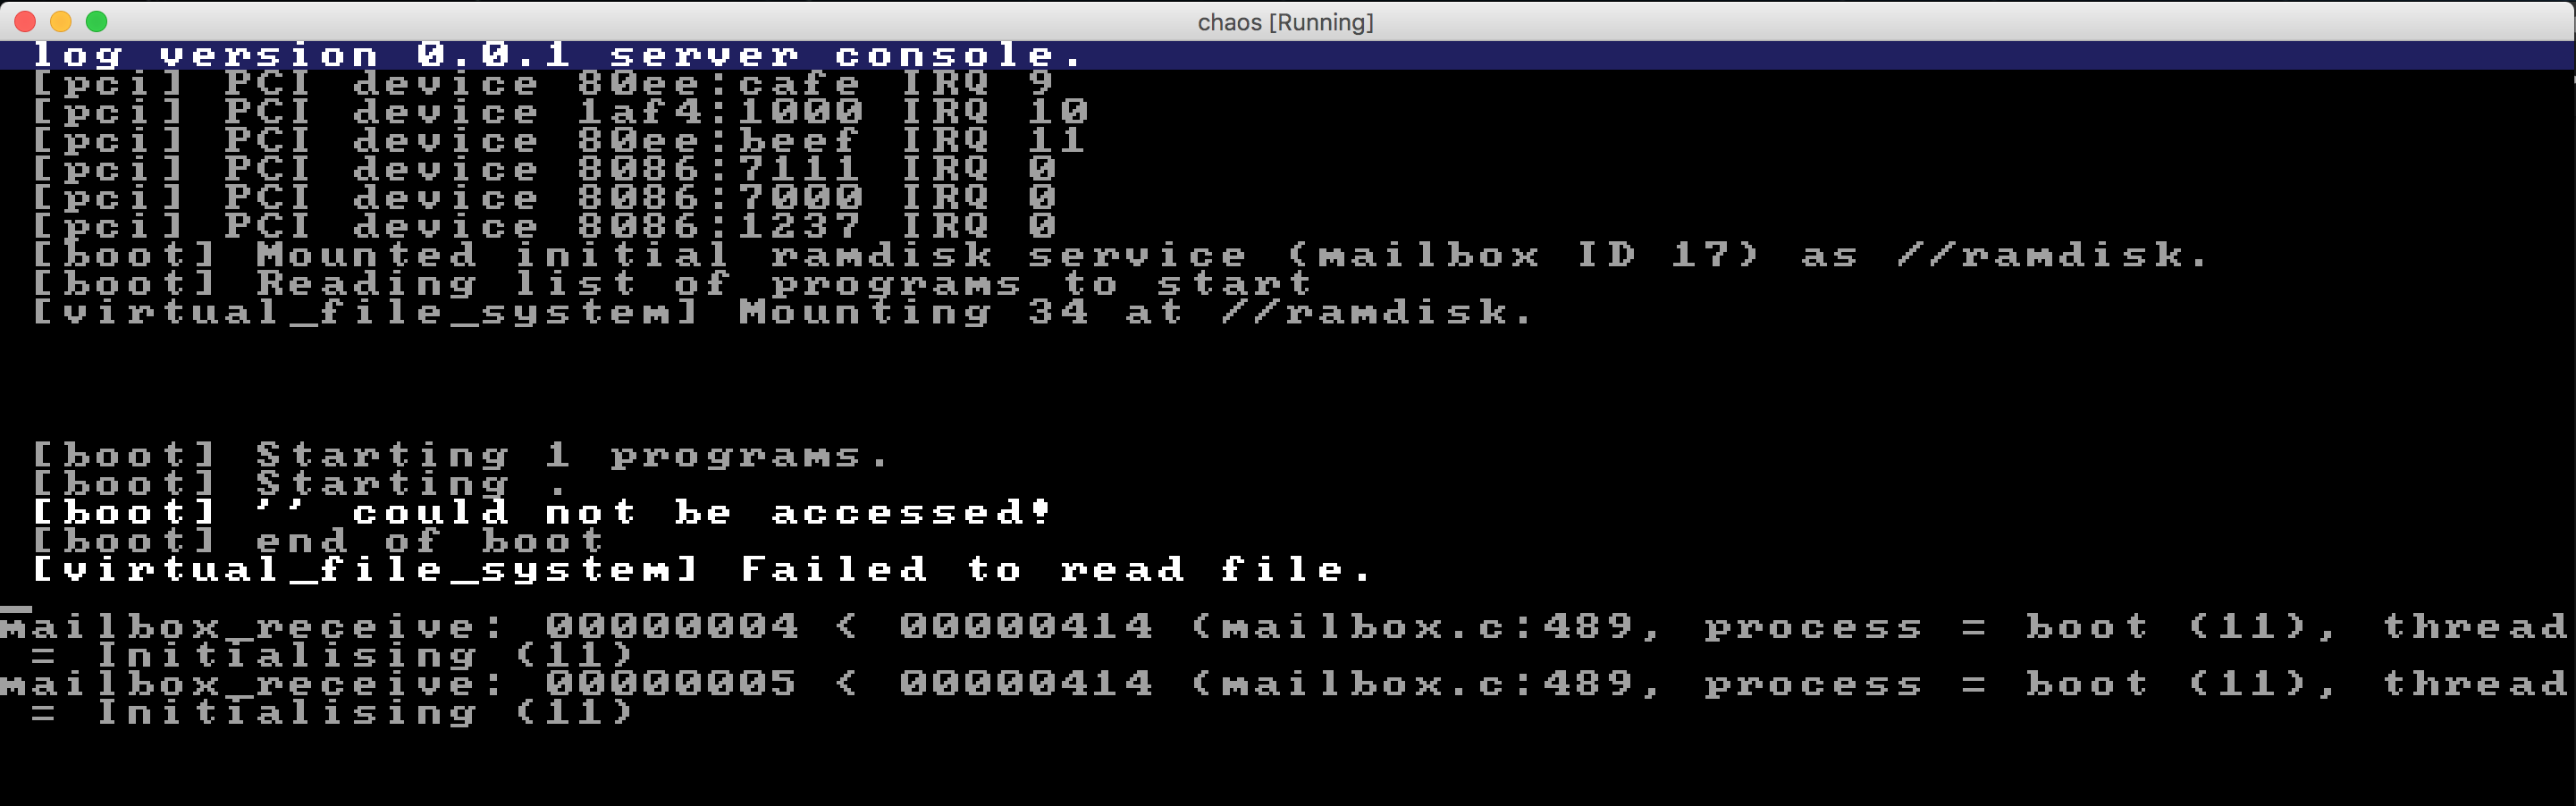
Why do we suddenly get three extra blank lines there in the middle?
What file is it failing to read, is it the empty string?
Why does it behave completely differently now? I must have made a mistake indeed...
Fear of making mistakes while refactoring
I think this, things breaking all of a sudden, definitely is one thing holding people back from aggressively refactoring. Sure, I am using a compiled, statically typed language (C in this case), so it's much easier and helpful than with dynamic languages like JavaScript or Ruby, but still - there's always a slight risk of making mistakes. A decent test suite with unit and/or integration tests covering large parts of the system is probably one of the better ways to deal with this. If I had 10 or 100 tests for the boot server, one or more of them would probably be failing now, perhaps leading me in the right direction... but in this case, I regretfully don't have any automated tests at all, so I have to more go with the "read the source code and think" approach instead.
Now, some people would say that this is exactly the reason why they don't like refactoring. Well, people are different, and it also depends greatly on the circumstances. I wouldn't do stuff like this the day before a critical release, but in this case there is really no "deadline" to be afraid of. Also, of course, there is always a risk in doing changes, but there is also a (sometimes even greater) risk in not doing any changes. A risk of "software rot", your program becoming more and more unmaintainable over time. Don't let fear caused by bad experiences in the past control your future. Instead, decide today to take one small step in the right direction - be it refactoring that old code you're thinking about, be it clean out the mess in your locker, be it to contact an old friend and ask for forgiveness for something you did years ago that hurt them... anything that helps you become a better you.
End of preaching, back to coding. ![]()
For starters, the mailbox.c message was obviously not very helpful unless you read the source code, so I started by improving that like this:
        DEBUG_MESSAGE(DEBUG, "Message was too large (max %u bytes, message size was %u bytes)",
                      message_parameter->length, mailbox->first_message->length);
But why is it now getting there in the first place? It feels like the IPC messages are "out of sync" somehow, like the one party is sending two messages and the other party receiving only one or something. Then, in the next call, the receiver will receive the now-queued message instead of the one it is expecting to be reading. This could be the case...
Trying to narrow down the problem
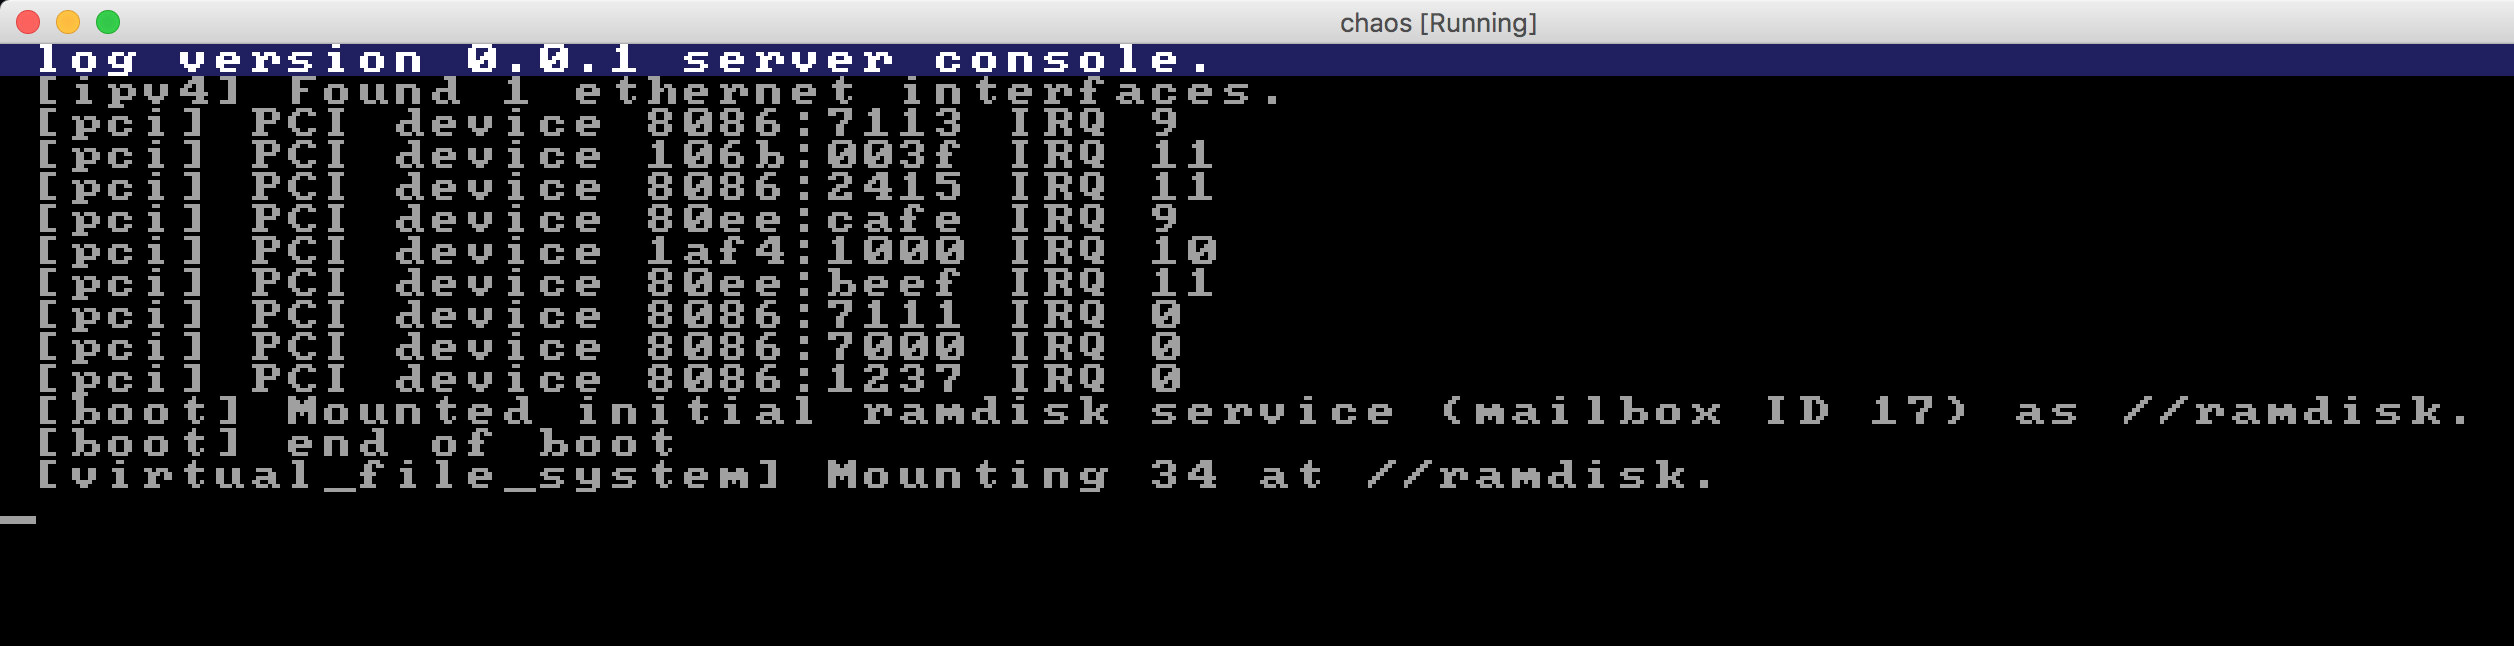
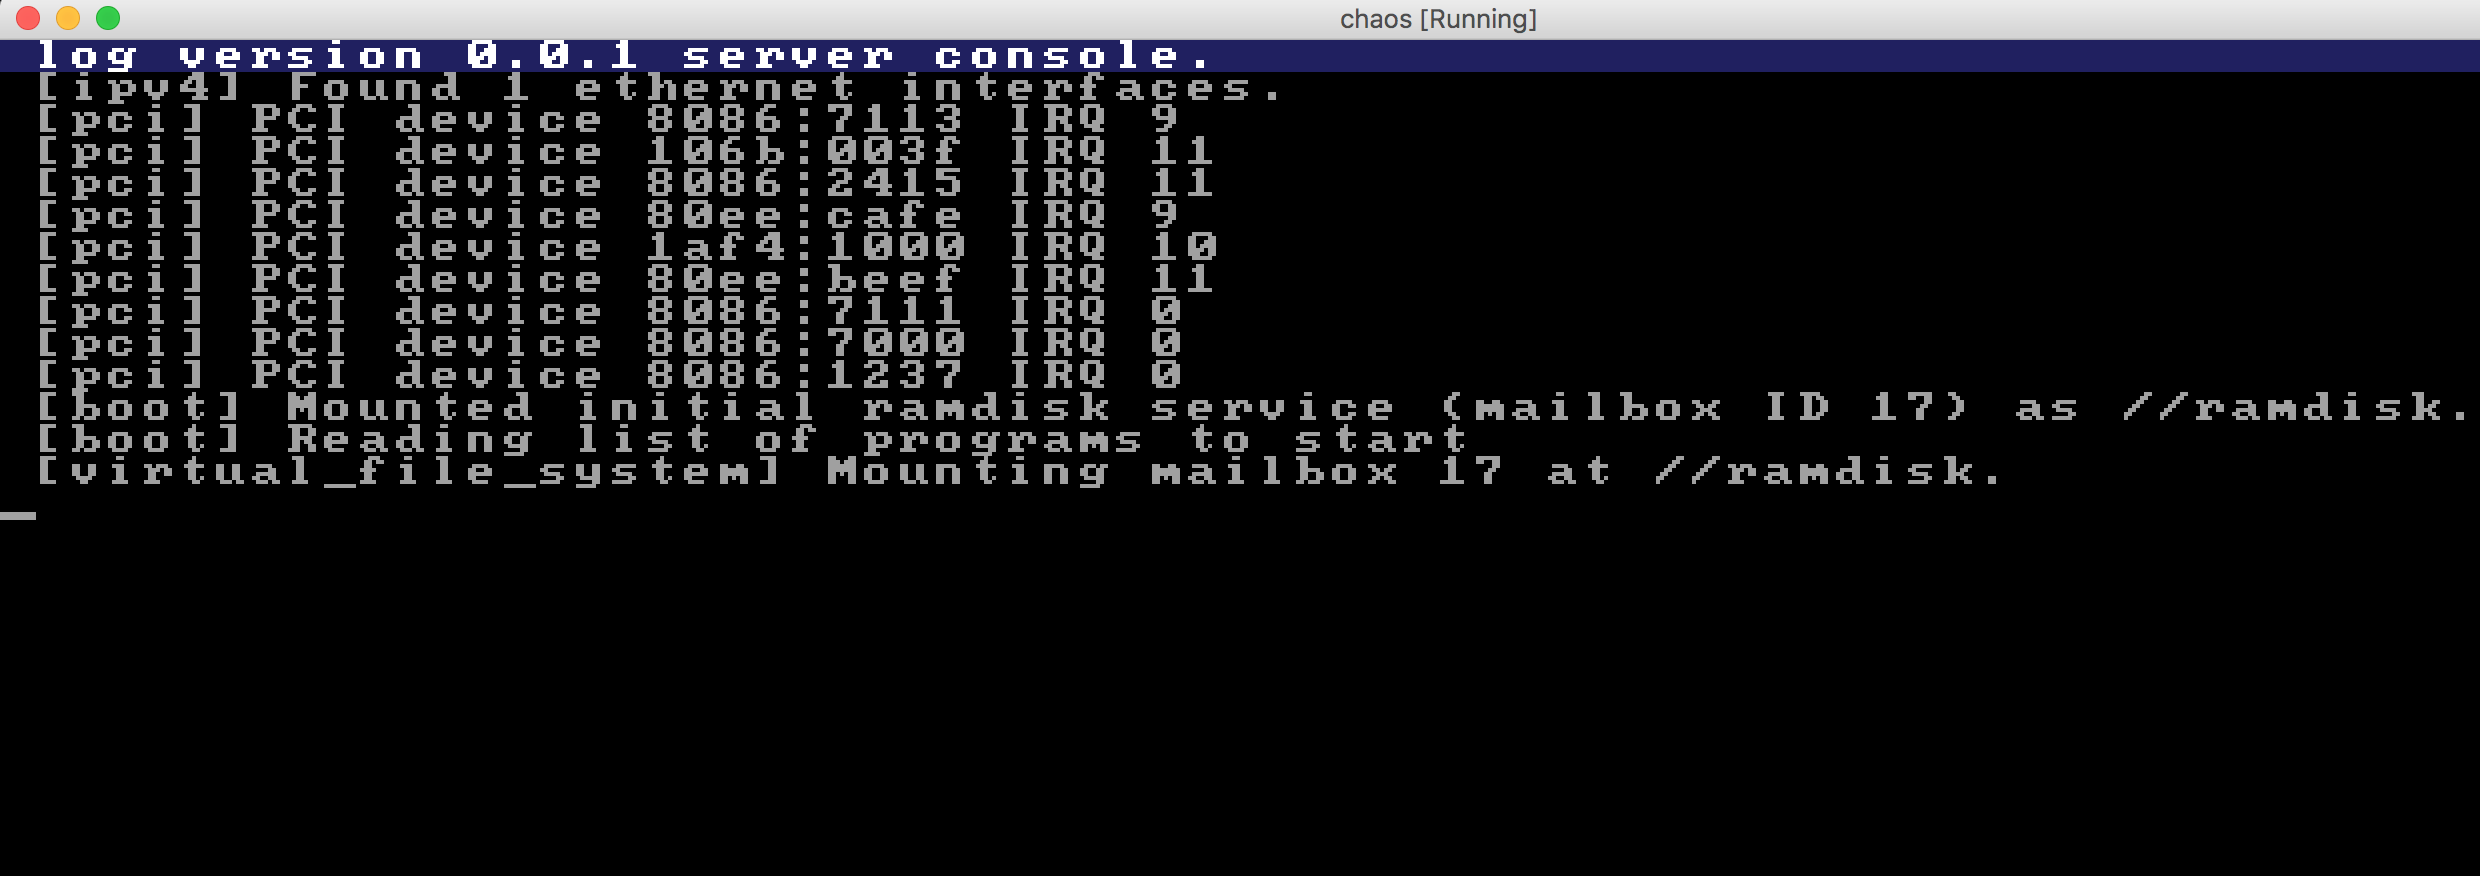
I decided to start by disabling some parts in the boot server to see where it's failing. Let's stop right before it reads the startup script and see the output when booting:
Alright, the error was now pin-pointed to this specific method:
static bool read_program_list(unsigned int *file_size)
{
    file_verbose_directory_entry_type directory_entry;

    log_print(&log_structure, LOG_URGENCY_DEBUG, "Reading list of programs to start");
    string_copy(directory_entry.path_name, STARTUP_FILE);
    if (file_get_info(&vfs_structure, &directory_entry) != FILE_RETURN_SUCCESS)
    {
        log_print(&log_structure, LOG_URGENCY_ERROR, STARTUP_FILE " not found.");

        return FALSE;
    }

    memory_allocate((void **) &program_list_buffer, directory_entry.size);

    file_handle_type handle;
    file_open(&vfs_structure, STARTUP_FILE, FILE_MODE_READ, &handle);
    file_read(&vfs_structure, handle, directory_entry.size, &program_list_buffer);

    *file_size = directory_entry.size;

    return TRUE;
}
One obvious error to the careful reader is the lack of error handling in the file_open call. If it will fail, the system will just carry on and pretend as if nothing has happened. That's bad, we should make it check the return value from file_open. The file_read method is also pretty bad at informing the reader why reading the file failed. Let's start by adding some more log output in file_read, to make it easier to debug issues like this. Again, simply applying the boy scout rule - small steps, making the universe a slightly better place with each step we take.
While adding some more log output to file_read, I saw that the problem now is that it tries to read from a non-existing file handle 0, so I'm quite sure that the root cause right now for the strange behavior is that the file_open call has started to fail, but it doesn't log anything there and the boot server just carries on happily, so that's why we get this. The error handling for the rest (parsing the file contents, starting the servers) is seemingly broken now after the refactoring, so instead of just logging that reading the file failed, it will try to do crazy things which will break badly. ![]() So I think that perhaps fixing the debug logging, and also implement proper error handling for the fail scenarios will make it at least stop right away when things go wrong...
So I think that perhaps fixing the debug logging, and also implement proper error handling for the fail scenarios will make it at least stop right away when things go wrong...
(I also found out places in the VFS server that didn't properly check return values, so I fixed these as well.)
Still wandering in the dark
I still wasn't quite sure what was happening; the added error handling and log output didn't give me that much yet. However, I was seeing now that this code:
    file_handle_type handle;
    if (file_open(&vfs_structure, STARTUP_FILE, FILE_MODE_READ, &handle) != FILE_RETURN_SUCCESS)
    {
        log_print(&log_structure, LOG_URGENCY_ERROR, "Failed opening " STARTUP_FILE);
        return FALSE;
    }
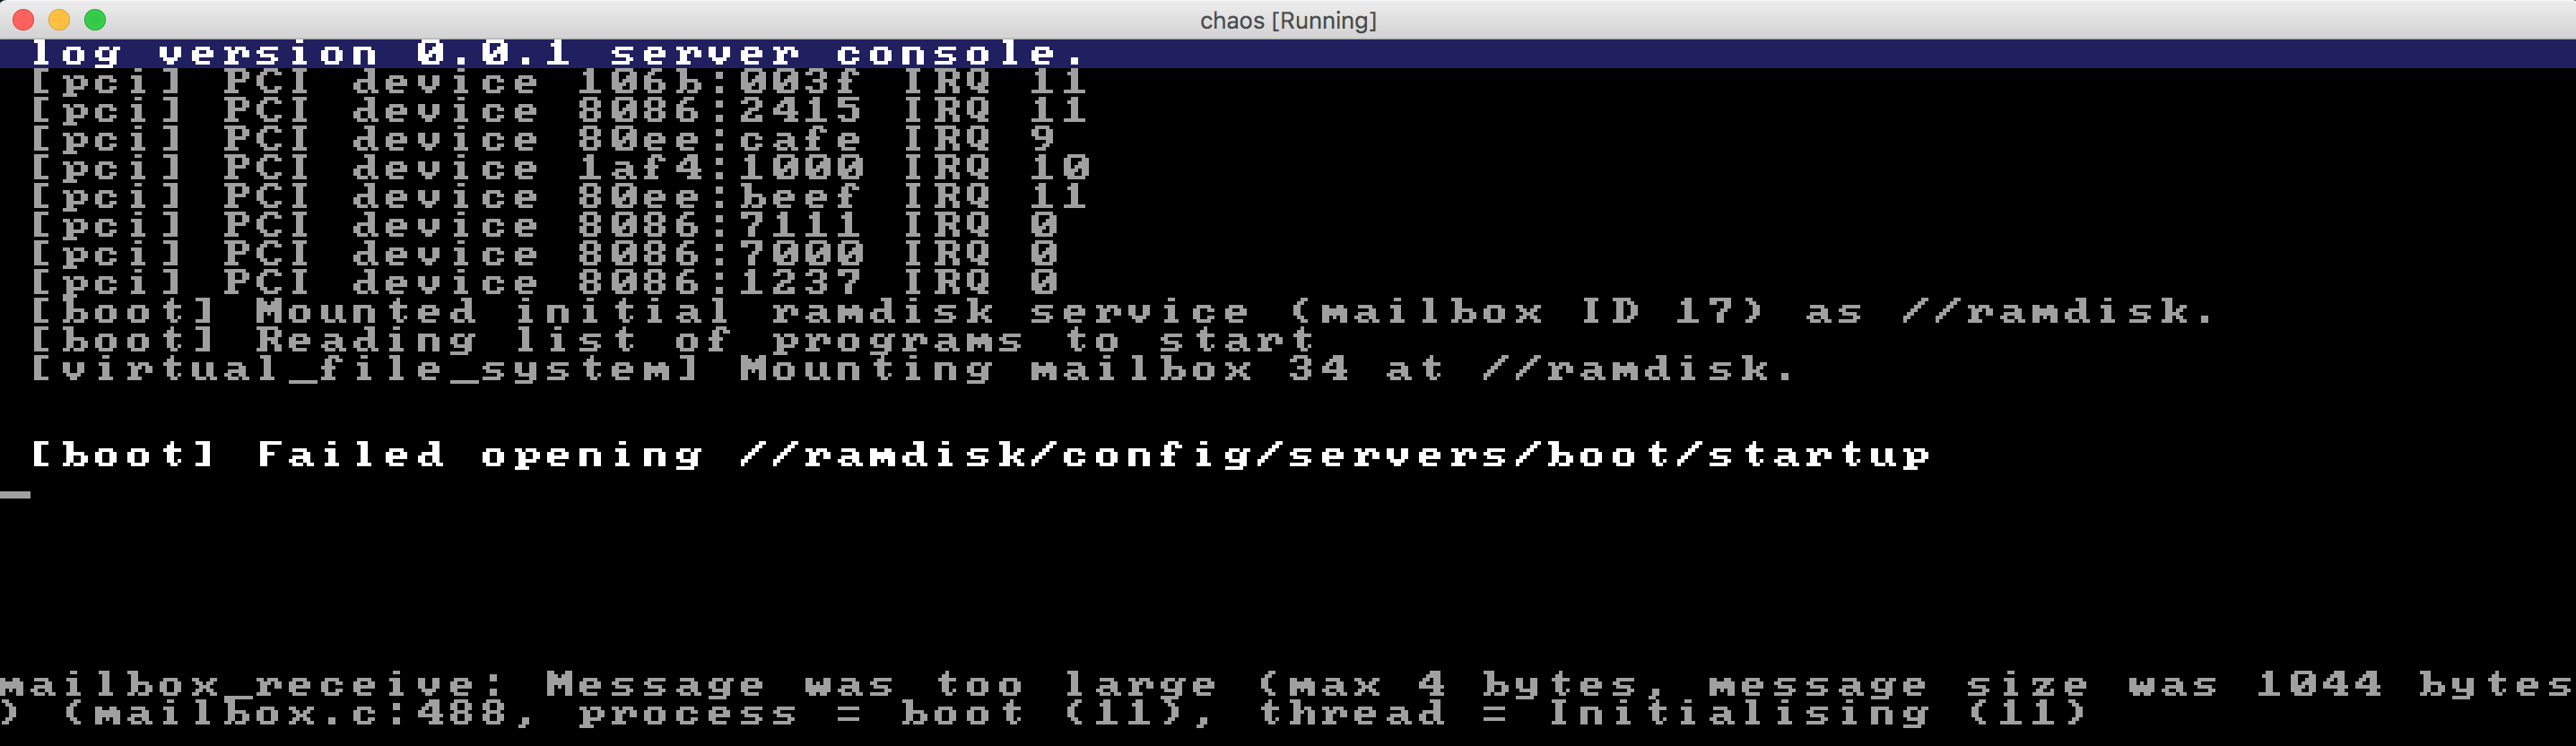
...would cause this output:

But why?
The file_open function is unfortunately again an example of a function with inadequate error handling:
return_type file_open(ipc_structure_type *vfs_structure, char *file_name, file_mode_type mode,
                      file_handle_type *handle)
{
    message_parameter_type message_parameter;
    file_open_type open;

    string_copy_max(open.file_name, file_name, MAX_PATH_NAME_LENGTH);
    open.mode = mode;

    message_parameter.protocol = IPC_PROTOCOL_FILE;
    message_parameter.message_class = IPC_FILE_OPEN;
    message_parameter.data = &open;
    message_parameter.block = TRUE;
    message_parameter.length = sizeof(file_open_type);

    system_call_mailbox_send(vfs_structure->output_mailbox_id, &message_parameter);

    message_parameter.data = handle;
    message_parameter.length = sizeof(file_handle_type);

    system_call_mailbox_receive(vfs_structure->input_mailbox_id, &message_parameter);
    return FILE_RETURN_SUCCESS;
}
Let's fix that. Both system_call_mailbox_send and system_call_mailbox_receive have a slight chance of failing, so we need to take that into account here.
We're now getting this. At least a different output. ![]()
Maybe it's time to bring out gdb again. The downside of it is that we might get spurious breaks in other processes than the boot server, but it might be worth it anyway.
gdb to the rescue
gdb hinted me that the system_call_mailbox_send was actually failing, which is incredibly weird if that's really the case. The annoying thing with debugging this in gdb is that part of the address space is taken care of by servers/system/boot/boot, and other parts by the storm kernel binary, so we can't point gdb to a single executable to be able to place breakpoints on specific function names, see the values of variables etc. Then we also have the whole multi-process and multi-thread architecture making it harder; the whole debug experience is simply very much sub-par at the moment. So maybe I'll just dig into the mailbox_send source code in the kernel for now...
Hmm, took a quick look there but couldn't find any obvious explanation to this. All the places where it can fail should print a debug message in that case, so it shouldn't really be the mailbox sending that is failing.
(This was again a very late night session, when I should have been going to be instead of sitting up debugging, but... I just... want to... fix that bug...
)
I enabled VERBOSE_DEBUG in mailbox.c, but just like the comment there stated, it makes the system unusable since the kernel log gets flooded with output...
Then I had an idea. Seems obvious, but: the mailbox_receive complains that it cannot receive the message because it's too large. What I use the gdb approach again and put a conditional breakpoint in mailbox_send, like this: break mailbox_send if mailbox_id == 34, couldn't that help?
By the way - mailbox ID 34, that seems incredibly weird. I mean, look at this screen shot:
The way it seems to be like is this:
- The VFS server is attempting to mount the initial ramdisk using mailbox 34 as the
//ramdiskvolume. - Then the boot server tries to open a file, this time reading from mailbox 34 (the
mailbox_receivelog output being printed.) - That doesn't compute. It seems like the boot server is telling VFS server to send the actual block service traffic to mailbox 34, i.e. our own connection to the VFS, which would cause exactly these spurious packages to appear in the mailbox. The
bootserver receives the traffic intended for the initial ramdisk server!
It's not a bug, it's a "feature"!
I think it actually boils down to the currently broken/unimplemented functionality now. I ran git blame on servers/file_system/virtual_file_system/virtual_file_system.c. git blame is a great tool when you want to discover how and when you have failed. ![]() Unfortunately, it didn't help since the code has looked like this all the way since 2007. I can't understand how this have ever worked...
Unfortunately, it didn't help since the code has looked like this all the way since 2007. I can't understand how this have ever worked...
The next step will be to fix the virtual_file_system service to not use the incoming ipc_structure for registering the mount point. Instead, it should use the incoming mailbox_id and based on that, create an IPC connection. So I think we are now down to the root cause - the VFS mounting failing. The thing that probably confused me a bit was the fact that it behaved somewhat differently (mailbox_receive printing log messages.) But let's do something hard - let's try to ignore that fact for now and instead resolve the problem.
The fix for this wasn't actually so complicated. Instead of the vfs_mount function looking like this:
static bool vfs_mount(file_mount_type *mount, ipc_structure_type *ipc_structure)
{
    memory_copy(&mount_point[mounted_volumes].ipc_structure, ipc_structure, sizeof(ipc_structure_type));
    mount_point[mounted_volumes].handled_by_vfs = FALSE;
    string_copy_max(mount_point[mounted_volumes].location, mount->location, MAX_PATH_NAME_LENGTH);
    mounted_volumes++;

    log_print_formatted(&log_structure, LOG_URGENCY_INFORMATIVE,
                        "Mounting mailbox %u at //%s.",
                        ipc_structure->output_mailbox_id, mount->location);
    return TRUE;
}
...it should look like this. The ipc_service_connection_request call is the key difference.
static bool vfs_mount(file_mount_type *mount)
{
    mount_point[mounted_volumes].ipc_structure.output_mailbox_id = mount->mailbox_id;
    if (ipc_service_connection_request(&mount_point[mounted_volumes].ipc_structure) != IPC_RETURN_SUCCESS)
    {
        log_print_formatted(&log_structure, LOG_URGENCY_ERROR,
                            "vfs_mount: Failed connecting to service with mailbox %u", mount->mailbox_id);
        return FALSE;
    }

    mount_point[mounted_volumes].handled_by_vfs = FALSE;
    string_copy_max(mount_point[mounted_volumes].location, mount->location, MAX_PATH_NAME_LENGTH);
    mounted_volumes++;

    log_print_formatted(&log_structure, LOG_URGENCY_INFORMATIVE,
                        "Mounting mailbox %u at //%s.",
                        mount->mailbox_id, mount->location);
    return TRUE;
}
Some other trivial errors in other servers surfaced now as well, which were easily fixable.
All errors gone, but still not working
But now, something odd happened. I didn't receive any errors any more, but it still didn't continue the booting...
I don't know about you, but to me, problems like this are some of the more annoying ones. It doesn't work, but I don't know why and no errors whatsoever are printed.
I thought at this point that enabling cluido on startup would perhaps be a good idea; it has a command which lets you see all threads of all processes and what they are blocked on. Good for debugging!
Here is what it looked like, with some highlightings of mine to make it clearer to the reader:
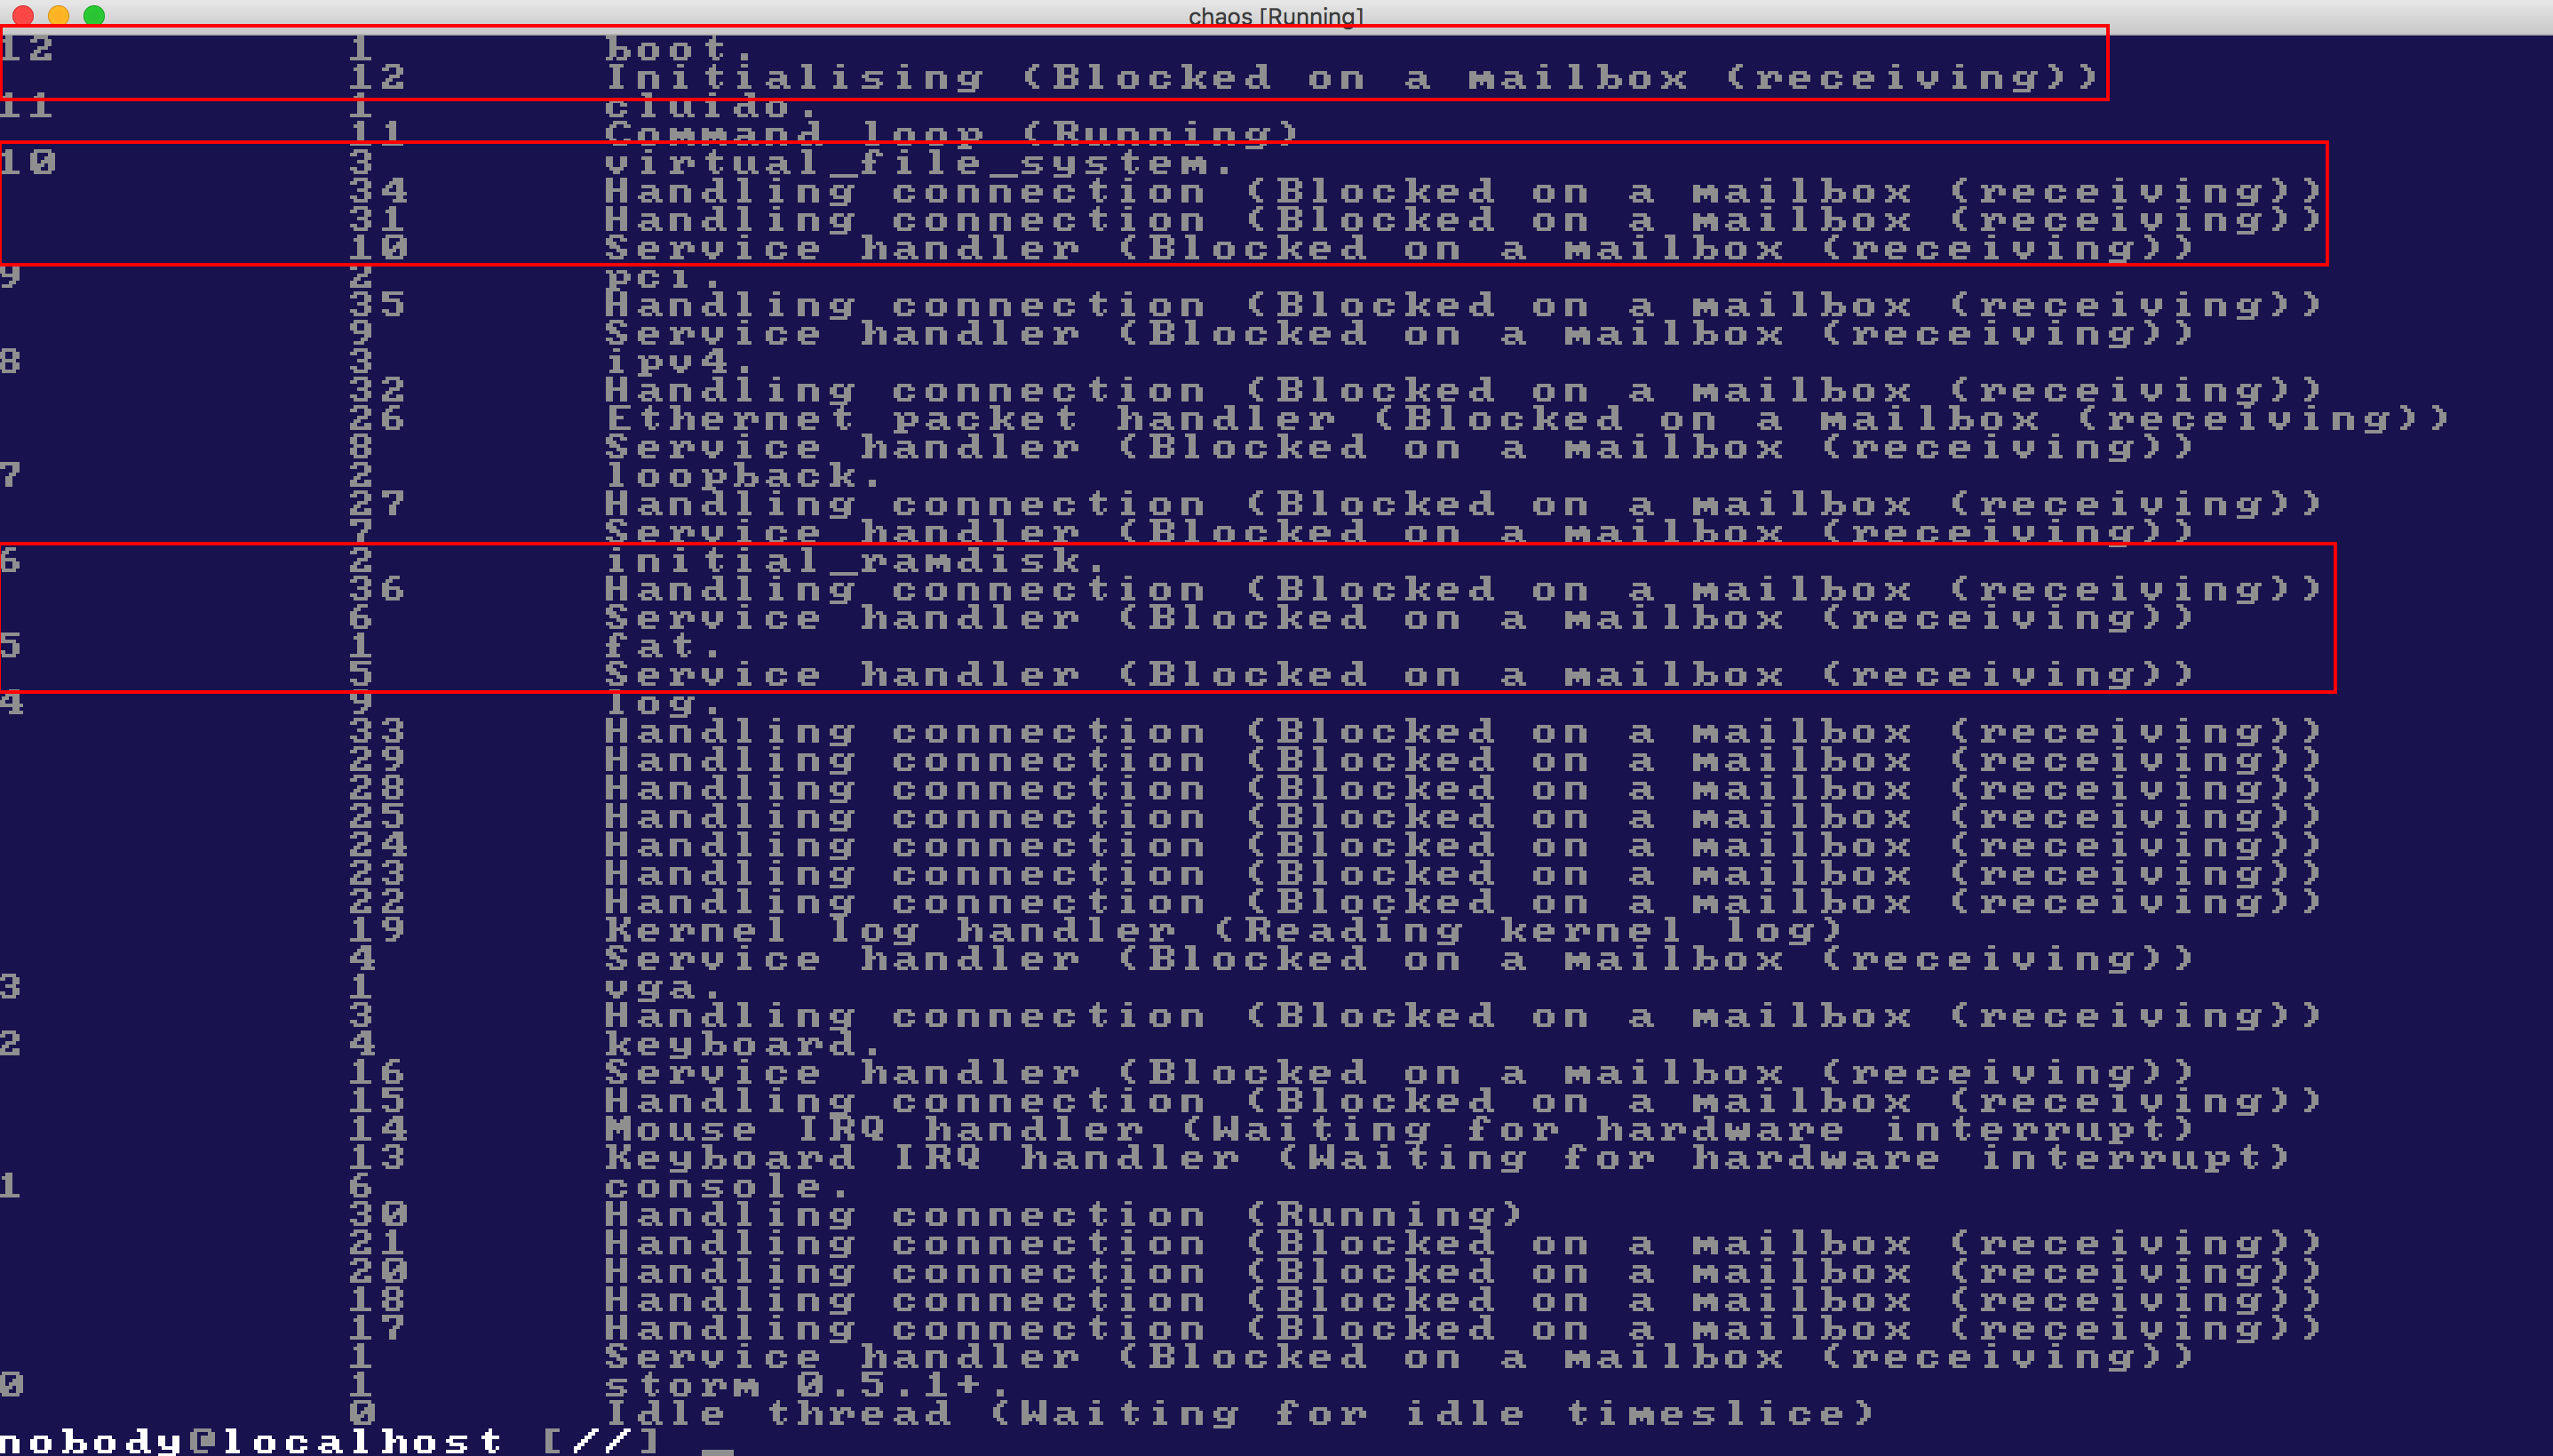
So the conclusion right now (these are in red):
- The
bootserver is waiting on a mailbox - not that surprising; that's pretty much what I'd have expected. - The
virtual_file_systemserver is waiting on two mailboxes, also receiving. That's a bit strange, could it be that it has tried to contact another server but stalled in doing so? (Side note: we should implement a timeout inmailbox_receive, for cases where you don't want a server to stall indefinitely just because it never receives an expected answer...) - The
initial_ramdiskis handling a connection, and has a service handler. Looks good. - The
fatserver has a service handler only, and this is probably the real problem here.
Realizing the serious flaw in my algorithm
During the day, when being mostly away from th ecomputer, I began thinking what the problem could be: was there was a fundamental flaw in the new vfs_mount algorithm? I then looked at the code, which confirmed my suspicion: The newly added code made it connect to the provided block service, using the standard IPC mechanisms built-in to the system. So it looked like this:
+---------------------+     +-----------------+
| virtual_file_system | --> | initial_ramdisk |
+---------------------+     +-----------------+
Do you see the obvious issue here? One significant layer of functionality is missing, namely, the server responsible for actually parsing the filesystem. A proper IPC structure would look like this, in this specific case (since the initial ramdisk is formatted with a FAT filesystem):
+---------------------+     +-----+     +-----------------+
| virtual_file_system | --> | fat | --> | initial_ramdisk |
+---------------------+     +-----+     +-----------------+
In other words, the VFS server must tell the fat server to mount the initial_ramdisk, and the VFS server will then only communicate with the fat server to get things done. That's the reason why things are not working now; the VFS server is sending its IPC commands to the wrong server, a server not being able to interpret the file_system protocol, so that's why it never gets any meaningful replies... ![]()
So, what I needed to do was to tweak the vfs_mount method lookup whatever file_system services was available and use it to mount the block device, instead of going straight to the initial_ramdisk.
Here is the new version of the function:
static bool vfs_mount(file_mount_type *mount)
{
    // FIXME: We only support one file_system implementation for now. A proper implementation would gather a more comprehensive
    // list of file system services, attempt to mount the volume with them all and see which one is successful.
    mailbox_id_type mailbox_id[1];
    unsigned int services = 1;

    if (ipc_service_resolve("file_system", mailbox_id, &services, 5, &empty_tag) != IPC_RETURN_SUCCESS)
    {
        log_print_formatted(&log_structure, LOG_URGENCY_ERROR, "vfs_mount: Failed to resolve file_system service");
        return FALSE;
    }

    mount_point[mounted_volumes].ipc_structure.output_mailbox_id = mailbox_id[0];
    if (ipc_service_connection_request(&mount_point[mounted_volumes].ipc_structure) != IPC_RETURN_SUCCESS)
    {
        log_print_formatted(&log_structure, LOG_URGENCY_ERROR,
                            "vfs_mount: Failed to establish connection with file system service with mailbox ID %u",
                            mailbox_id[0]);
        return FALSE;
    }

    message_parameter_type message_parameter;
    message_parameter.protocol = IPC_PROTOCOL_FILE;
    message_parameter.message_class = IPC_FILE_MOUNT_VOLUME;
    message_parameter.length = sizeof(mailbox_id_type);
    message_parameter.data = &mount->mailbox_id;

    if (ipc_send(mount_point[mounted_volumes].ipc_structure.output_mailbox_id, &message_parameter) != IPC_RETURN_SUCCESS)
    {
        log_print_formatted(&log_structure, LOG_URGENCY_ERROR,
                            "vfs_mount: Failed to send IPC message to mailbox ID %u",
                            mailbox_id[0]);
        return FALSE;
    }

    mount_point[mounted_volumes].handled_by_vfs = FALSE;
    string_copy_max(mount_point[mounted_volumes].location, mount->location, MAX_PATH_NAME_LENGTH);
    mounted_volumes++;

    log_print_formatted(&log_structure, LOG_URGENCY_INFORMATIVE,
                        "Mounting mailbox %u at //%s.",
                        mount->mailbox_id, mount->location);
    return TRUE;
}
Slightly more complex than before, and even worse; it didn't even work. Here's the error I got on startup:
Sigh. As C3PO would have it, will this never end? When I thought I had the resolution in place, new errors are coming up... ![]()
Digging into the fat server
The part of the fat server that is printing this message looks like this:
case IPC_FILE_GET_INFO:
{
    if (mounted)
    {
        file_verbose_directory_entry_type *directory_entry = (file_verbose_directory_entry_type *) data;

        if (!fat_file_get_info(&fat_info, directory_entry))
        {
            return_type return_value = FILE_RETURN_FILE_ABSENT;

            log_print_formatted(&log_structure, LOG_URGENCY_ERROR, "IPC_FILE_GET_INFO failed");
            message_parameter.message_class = IPC_FILE_RETURN_VALUE;
            message_parameter.data = &return_value;
            message_parameter.length = sizeof(return_type);
        }

        ipc_send(ipc_structure.output_mailbox_id, &message_parameter);
    }
    break;
}
So, fat_file_get_info is failing for some reason... I wonder why. To learn more about why things were failing, I added some more logging in the fat server. This was the output now:
I think this was the time to bring out gdb again... Here's the (somewhat abbreviated) session:
vagrant@debian-9rc1-i386:/vagrant$ gdb servers/file_system/fat/fat
GNU gdb (Debian 7.12-6) 7.12.0.20161007-git
[...]
Reading symbols from servers/file_system/fat/fat...done.
(gdb) break fat_file_get_info
Breakpoint 1 at 0x40001ab0: file fat_file_get_info.c, line 12.
(gdb) cont
Continuing.

Breakpoint 1, fat_file_get_info (fat_info=0xfc000f14, file_info=0x7d7000) at fat_file_get_info.c:12
12  {
(gdb) next
13      unsigned int elements = MAX_PATH_ELEMENTS;
(gdb)
18      log_print_formatted(&log_structure, LOG_URGENCY_DEBUG, "fat_file_get_info opening '%s'.", file_info->path_name);
(gdb)
22      path_split(file_info->path_name, path, &elements);
(gdb) file_info->path_name
Undefined command: "file_info->path_name".  Try "help".
(gdb) print file_info->path_name
$1 = "/config/servers/boot/startup\000\000startup", '\000' <repeats 771 times>...
(gdb) next
25      if (elements < 1)
(gdb) print file_info->path_name
$2 = "\000config\000servers\000boot\000startup\000\000startup", '\000' <repeats 771 times>...
(gdb) print elements
$3 = 4
Hmm, that's interesting. The file_info->path_name seems to contain some extra garbage at the end. That should be fine though, since it's a null-terminated string and it will just happen to contain whatever happened to be at that memory (probably a stack-based variable) at the time it was created.
Let's continue a few source lines:
(gdb) next
34      if (!fat_directory_read(fat_info, path, elements - 1, &fat_entry))
(gdb)
42      our_file = get_entry_by_name(fat_entry, path[elements - 1]);
(gdb) print fat_entry
$1 = (fat_entry_type *) 0x400094c0 <directory_buffer>
(gdb) print *fat_entry
$2 = {name = "CONFIG\000 ", extension = "\000  ", read_only = 0 '\000', hidden = 0 '\000', system = 0 '\000', volume_id = 0 '\000',
  directory = 1 '\001', archive = 0 '\000', reserved = 0 '\000', nt_reserved = 8 '\b', creation_hundreds = 0 '\000', creation_time = {
    hours = 0, minutes = 50, seconds = 16}, creation_date = {year = 72, month = 6, day = 9}, access_date = {year = 72, month = 6,
    day = 9}, first_cluster_number_high = 0, update_time = {hours = 0, minutes = 50, seconds = 16}, update_date = {year = 72, month = 6,
    day = 9}, first_cluster_number_low = 2, file_size = 0, next = 0x400094e0 <directory_buffer+32> ""}
(gdb) next
45      if (our_file == NULL)
(gdb) print our_file
$3 = (fat_entry_type *) 0x0
(gdb) print path[elements - 1]
$4 = 0x7d7015 "startup"
Hmm... *scratches head*...
config is the name of the root-level folder. In fact, this is what it looks like, the whole folder structure of the ramdisk (courtesy of mtools):
 Volume in drive U has no label
 Volume Serial Number is F50C-F520
Directory for U:/

config       <DIR>     2017-10-08  16:50
        1 file                    0 bytes

Directory for U:/config

.            <DIR>     2017-10-08  16:50
..           <DIR>     2017-10-08  16:50
servers      <DIR>     2017-10-08  16:50
        3 files                   0 bytes

Directory for U:/config/servers

.            <DIR>     2017-10-08  16:50
..           <DIR>     2017-10-08  16:50
boot         <DIR>     2017-10-08  16:50
        3 files                   0 bytes

Directory for U:/config/servers/boot

.            <DIR>     2017-10-08  16:50
..           <DIR>     2017-10-08  16:50
startup             16 2017-10-08  16:50
        3 files                  16 bytes

Total files listed:
       10 files                  16 bytes
                         16 717 824 bytes free
By looking at the get_entry_by_name source code, I see that the fat_entry seems to be an indexable array. Let's dig a bit further into and see what other entries we have there (if any.)
(gdb) print fat_entry[1]
$5 = {name = "\000\000\000\000\000\000\000", extension = "\000\000", read_only = 0 '\000', hidden = 0 '\000', system = 0 '\000',
  volume_id = 0 '\000', directory = 0 '\000', archive = 0 '\000', reserved = 0 '\000', nt_reserved = 0 '\000',
  creation_hundreds = 0 '\000', creation_time = {hours = 0, minutes = 0, seconds = 0}, creation_date = {year = 0, month = 0, day = 0},
  access_date = {year = 0, month = 0, day = 0}, first_cluster_number_high = 0, update_time = {hours = 0, minutes = 0, seconds = 0},
  update_date = {year = 0, month = 0, day = 0}, first_cluster_number_low = 0, file_size = 0, next = 0x40009500 <directory_buffer+64> ""}
Okay, a null-terminated string. So that means the end of the file allocation table for this folder. But why did it give us the root folder instead of the proper subfolder?
I think we need to go back one step, to the fat_directory_read function. But first, let's see what the fat_info looks like, just for reference:
(gdb) print *fat_info
$7 = {sectors_per_cluster = 4, bytes_per_sector = 512, first_data_sector = 100, root_directory_sectors = 32, bytes_per_cluster = 2048,
  block_structure = {input_mailbox_id = 46, output_mailbox_id = 47}, fat = 0x40005340 <global_fat>, root = 0x4000d8c0 <global_root>,
  bits = 16}
I noted that the fat_directory_read had some useful debug logging there in the code which was commented out, so I uncommented that and re-booted the system.
Here is what it looked like at this point:
A potential issue: lower-case vs upper-case
The careful reader will perhaps start thinking like me when seeing these messages: could the difference between upper-case and lower-case config and upper-case CONFIG be a part of the problem here? Good question!
The thing is that the LFN (long file name) support for FAT file systems was not originally there, it was a hack that Microsoft added at the time of Windows 95, to be able to compete with other systems (*cough* OS/2
) which already had long file systems, and a much superior system architecture in general. But just like we know, the technically superior doesn't always win and this was sadly the case here also. Win95 "won" the consumer operating system war over OS/2, and so we ended up using a 32-bit graphical frontend on top of a 16-bit operating system etc... you know what I mean.
Anyway, suffice it to say that long file names aren't natively supported on FAT. And, case in file names is handled a bit specially, if I remember correctly: the MS-DOS (short) names are always uppercase. So what I am suspecting here is that mtools isn't really generating any (lower-case) LFN entries for us in this case => only the CONFIG folder do exist, and our string comparisons are probably case sensitive (which they should probably not be in the case of FAT, since it's a case-preserving but case-insensitive file system by design.)
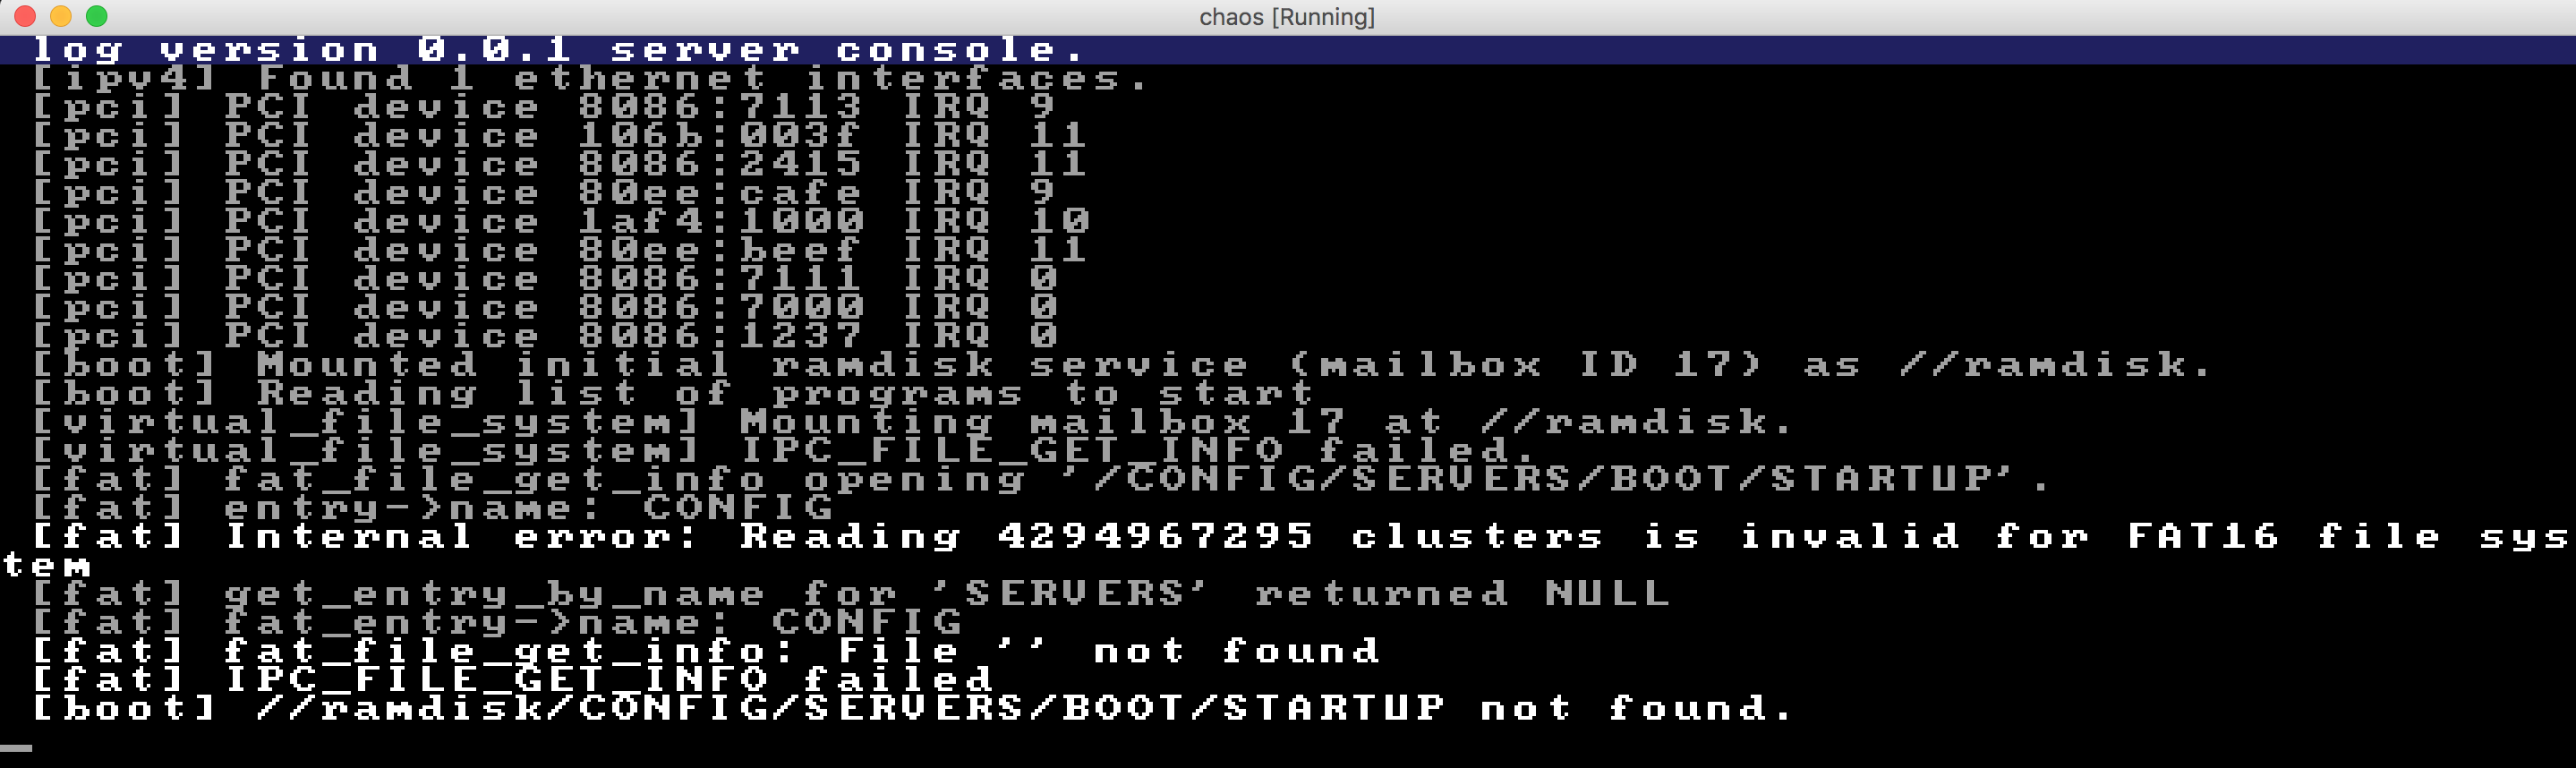
This is easily tested: let's just change the path of the startup script in the boot server:
#define STARTUP_FILE "//ramdisk/CONFIG/SERVERS/BOOT/STARTUP"
I recompiled and rebooted (again...), just to see this:
Those are the times when you pretty much feel like throwing the machine out the window, but let's not do that yet. :godmode: Well, at least it behaves differently, that's for sure!
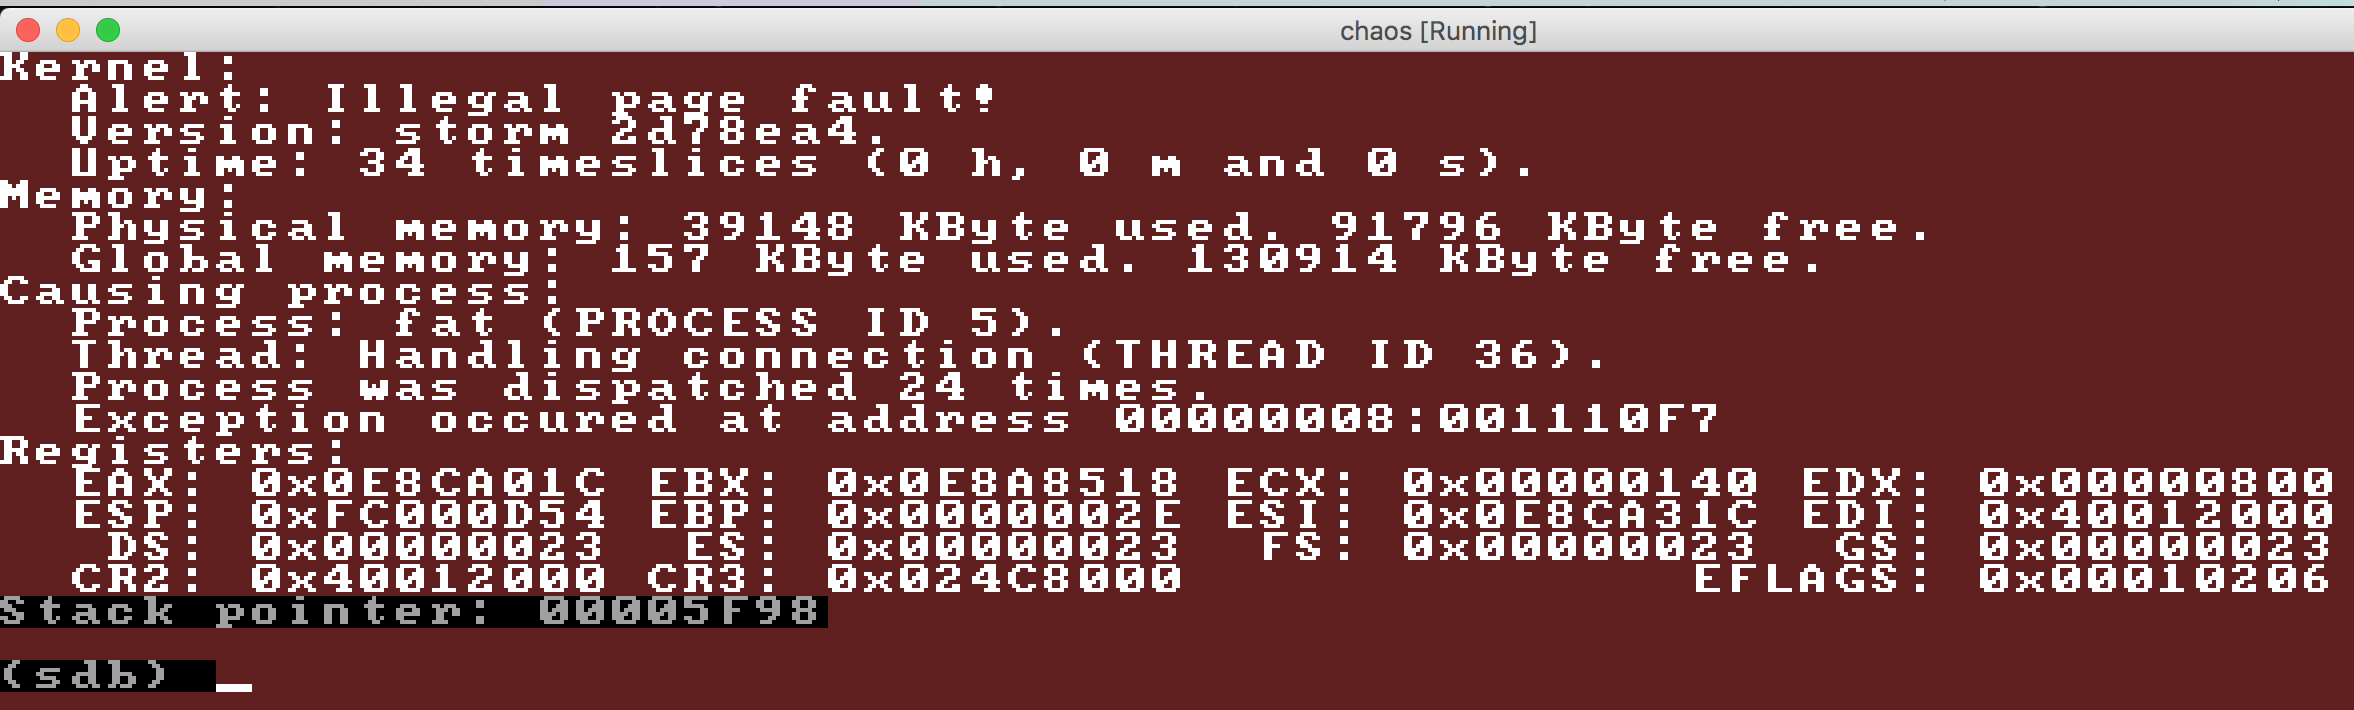
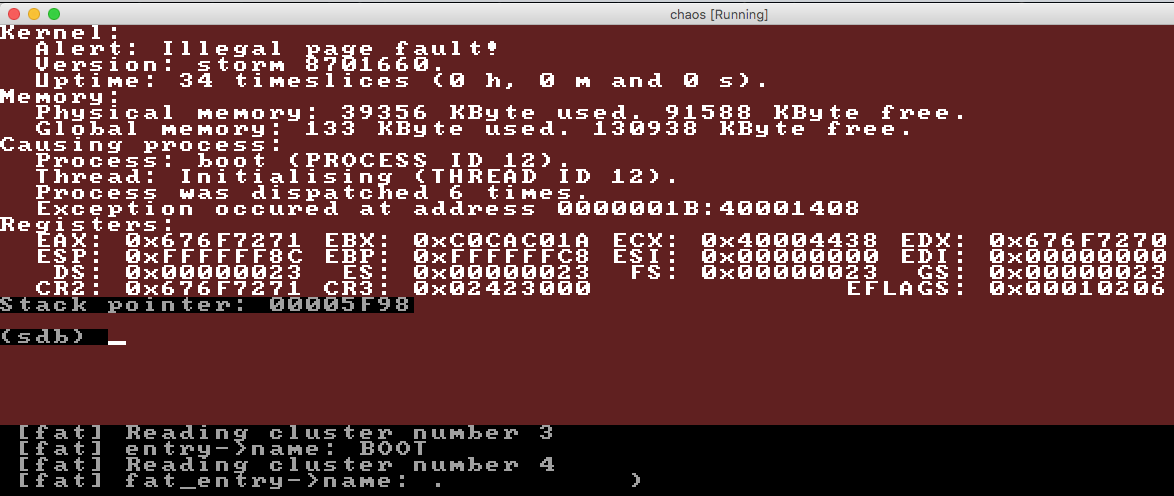
Illegal page fault in the fat process
The EIP address in this case is a kernel-address; that's easily spotted since the kernel runs at 0x100000 and upwards, where our normal user-level processes gets loaded at 0x40000000 and higher. I used my little friend objdump -S once more, and saw that mailbox_receive was at fault this time. More specifically, these lines:
        memory_copy(message_parameter->data, mailbox->first_message->data, mailbox->first_message->length);
  1110ee:       83 c0 1c                add    $0x1c,%eax
  1110f1:       c1 f9 02                sar    $0x2,%ecx
  1110f4:       89 c6                   mov    %eax,%esi
  1110f6:       fc                      cld
  1110f7:       f3 a5                   rep movsl %ds:(%esi),%es:(%edi)    <--- This instruction causes the error.
  1110f9:       f6 c2 02                test   $0x2,%dl
  1110fc:       74 02                   je     111100 <mailbox_receive+0x2e0>
  1110fe:       66 a5                   movsw  %ds:(%esi),%es:(%edi)
  111100:       f6 c2 01                test   $0x1,%dl
  111103:       74 01                   je     111106 <mailbox_receive+0x2e6>
  111105:       a4                      movsb  %ds:(%esi),%es:(%edi)
So, what do we do now? I could place a gdb breakpoint in trap_page_fault... and see the parameters to the mailbox_receive call by going up a few levels in call stack. Said and done:
vagrant@debian-9rc1-i386:/vagrant$ gdb storm/x86/storm
GNU gdb (Debian 7.12-6) 7.12.0.20161007-git
[...]

warning: No executable has been specified and target does not support
determining executable automatically.  Try using the "file" command.
0x0000877d in ?? ()
Reading symbols from storm/x86/storm...done.
(gdb) break trap.c:237
Breakpoint 1 at 0x10909b: file trap.c, line 237.
(gdb) cont
Continuing.

Breakpoint 1, trap_page_fault () at trap.c:237
237             debug_crash_screen("Illegal page fault", current_tss);
(gdb) bt
#0  trap_page_fault () at trap.c:237
#1  0x00000002 in ?? ()
Hmm, not so helpful. This is of course since the trap_page_fault function isn't really called using normal calling conventions, but rather being called as as a "trap" handler, and trap & IRQ handlers don't follow exactly the normal calling conventions => gdb doesn't manage to automatically help us with printing a proper stack trace in this case.
How about printing the current_tss object, does it give us any helpful clues?
(gdb) print *current_tss
$2 = {previous_task_link = 0, u0 = 0, esp0 = 4227862528, ss0 = 16, u1 = 0, esp1 = 0, ss1 = 0, u2 = 0, esp2 = 0, ss2 = 0, u3 = 0,
  cr3 = 38555648, eip = 1118455, eflags = 518, eax = 244088860, ecx = 320, edx = 2048, ebx = 243927256, esp = 4227861844, ebp = 46,
  esi = 244089628, edi = 1073815552, es = 35, u4 = 0, cs = 8, u5 = 0, ss = 16, u6 = 0, ds = 35, u7 = 0, fs = 35, uint8_t = 0, gs = 35,
  u9 = 0, ldt_selector = 0, u10 = 0, t = 0, u11 = 0, iomap_base = 352, process_type = 1, process_id = 5, cluster_id = 0, thread_id = 36,
  parent_tss = 0xa000, user_id = 0, priority_process = 0, priority_cluster = 0, priority_thread = 0, stack_pages = 1,
  allocated_pages = 20, mutex_kernel = 0x0, mutex_user_id = 0, mutex_time = 34, mailbox_id = 46, state = 0, timeslices = 24,
  thread_name = "Handling connection", '\000' <repeats 108 times>, code_base = 4842, data_base = 4846, code_pages = 4, data_pages = 13,
  virtual_code_base = 1073745920, virtual_data_base = 1073762304, iomap_size = 0, capability = {modify_services = 0,
    modify_hardware = 0, thread_control_others = 0, kill_other_threads = 0}, initialised = 1, instruction_pointer = 0,
  process_info = 0xe899198, iomap = 0xe8a7b78 ""}
Nothing obvious comes to mind. It was again midnight, so I had to leave it for now and continue some day later.
Analyzing the page fault further
process_id = 5 it says there, which should be the fat server, which is in turn also confirmed by the screenshot above. So, the fat server tries to receive data from a mailbox, but in doing so it exceeds the boundaries of mapped memory.
Let's read the ELF sections from the fat server and see what they look like. Again, readelf turns out to be an invaluable debugging tool:
vagrant@debian-9rc1-i386:/vagrant$ readelf -S servers/file_system/fat/fat
There are 18 section headers, starting at offset 0x17a90:

Section Headers:
  [Nr] Name              Type            Addr     Off    Size   ES Flg Lk Inf Al
  [ 0]                   NULL            00000000 000000 000000 00      0   0  0
  [ 1] .note.gnu.build-i NOTE            400000d4 0000d4 000024 00   A  0   0  4
  [ 2] .eh_frame         PROGBITS        400000f8 0000f8 000d18 00   A  0   0  4
  [ 3] .eh_frame_hdr     PROGBITS        40000e10 000e10 000174 00   A  0   0  4
  [ 4] .text             PROGBITS        40001000 001000 0038dc 00  AX  0   0 16
  [ 5] .data             PROGBITS        40005000 005000 00037c 00  WA  0   0 32
  [ 6] .bss              NOBITS          40005380 00537c 00c588 00  WA  0   0 32
  [ 7] .comment          PROGBITS        00000000 00537c 000025 01  MS  0   0  1
  [ 8] .debug_aranges    PROGBITS        00000000 0053a1 000248 00      0   0  1
  [ 9] .debug_info       PROGBITS        00000000 0055e9 00765c 00      0   0  1
  [10] .debug_abbrev     PROGBITS        00000000 00cc45 001fe5 00      0   0  1
  [11] .debug_line       PROGBITS        00000000 00ec2a 002308 00      0   0  1
  [12] .debug_str        PROGBITS        00000000 010f32 00240e 01  MS  0   0  1
  [13] .debug_loc        PROGBITS        00000000 013340 003637 00      0   0  1
  [14] .debug_ranges     PROGBITS        00000000 016977 000530 00      0   0  1
  [15] .symtab           SYMTAB          00000000 016ea8 000630 10     16  39  4
  [16] .strtab           STRTAB          00000000 0174d8 0004fc 00      0   0  1
  [17] .shstrtab         STRTAB          00000000 0179d4 0000b9 00      0   0  1
Key to Flags:
  W (write), A (alloc), X (execute), M (merge), S (strings), I (info),
  L (link order), O (extra OS processing required), G (group), T (TLS),
  C (compressed), x (unknown), o (OS specific), E (exclude),
  p (processor specific)
The failing memory access was indicated by the CR2 value in the screenshot above, which had a value of 0x40012000. The section which was highest in memory here was .bss, which had a maximum address of 0x40005380 + 0xc588 = 0x40005fd8 if my calculation is right.
That's obviously quite a few pages below 0x40012000. I wonder if this could be part of the heap for the fat server; doesn't sound quite unlikely. In cases like this, it would probably make sense to have a debug flag to ensure that heap allocations are always starting at 0x50000000 or something, in development mode. It would make it easier to draw fast conclusions about things. Right now, I think we use the approach of trying to make as much as possible of the virtual address space available for user allocations, which is useful to not waste any more virtual address space than absolutely needed, but has the drawback just mentioned.
Before doing anything else here, I wanted to make sure that the boot server hadn't actually managed to read the startup script, and was already continuing with its next task. In other words: just making 100% sure that the problem I am seeing is still related to the reading of the config file. I was about to comment out the rest of the code in the boot server again, but then I saw this line:
log_print_formatted(&log_structure, LOG_URGENCY_DEBUG, "Starting %u programs.", number_of_programs);
This message never gets printed to the log console, so then we can be 100% sure that it never gets that far. Alright, let's look at the mailbox_receive calls it does, and the size of buffers it allocated and that kind of stuff.
Finding and following a trail: read_clusters as a potential candidate for the crash
Hmm. I got an idea. How about this trail, looking closer at this section of the code:
log_print_formatted(
    &log_structure,
    LOG_URGENCY_DEBUG,
    "entry->name: %s",
    entry->name
);

read_clusters(
    fat_info,
    &directory_buffer,
    (entry->first_cluster_number_high << 16) +
        entry->first_cluster_number_low,
    0,
    UINT32_MAX
);
The entry->name line is actually the last line that gets printed, and reading one or more FAT clusters is definitely an operation that could fail. Let's try putting a breakpoint right there, in read_clusters.
vagrant@debian-9rc1-i386:/vagrant$ gdb -ex 'file servers/file_system/fat/fat'
GNU gdb (Debian 7.12-6) 7.12.0.20161007-git
[...]

warning: No executable has been specified and target does not support
determining executable automatically.  Try using the "file" command.
0x00110350 in ?? ()
A program is being debugged already.
Are you sure you want to change the file? (y or n) y
Reading symbols from servers/file_system/fat/fat...done.
(gdb) break read_clusters
Breakpoint 1 at 0x400010a0: file clusters.c, line 76.
(gdb) cont
Continuing.

Breakpoint 1, read_clusters (fat_info=0x4, output=0xc0cac01a, start_cluster=0, skip=0, number_of_clusters=0) at clusters.c:76
76  {
(gdb) cont
Continuing.

Breakpoint 1, read_clusters (fat_info=0xfc000f14, output=0x40009500 <directory_buffer>, start_cluster=2, skip=0, number_of_clusters=4294967295)
    at clusters.c:76
76  {
(gdb) cont
Continuing.
The first time the breakpoint got called was a spurious breakpoint, since all processes share the same start address (which is discussed further in chaos#104.) The second time, however, represents the real problem! How interesting! Let's restart it again (since it crashed) and see if we can step a bit into the read_clusters method. Skipping some of the output here as to not get excessively carried away with the copy & paste, but let's conclude that I stepped a bit further into the place where it would actually do the IPC - namely clusters.c
Debugging this turned out to be a mess, so I ended up trying to fix chaos#104 at this point... It was simply so frustrating trying to put a breakpoint and having it break 10 times for unrelated calls, with garbage function parameters.
Strange! Even after having moved the fat server to a location 32 MiB higher, i.e. 0x42000000, I still get these same strange spurious breakpoints. How about if I move it to a much higher address, say 0x50000000 (256 MiB higher than other binaries)? In line with the "if at first you don't succeed, try again" philosophy. A very sophisticated philosophy indeed. ![]()
Moving it there helped, so it must be that I needed to space the processes a bit further away from each other. Works for me, it's not really an issue right now. This led me to this very interesting debug session! (do I need to say it's past midnight again?)
vagrant@debian-9rc1-i386:/vagrant$ gdb -ex 'file servers/file_system/fat/fat'
GNU gdb (Debian 7.12-6) 7.12.0.20161007-git
[...]

(gdb) break read_single_cluster
Breakpoint 1 at 0x500010f0: read_single_cluster. (2 locations)
(gdb) cont
Continuing.

Breakpoint 1, read_clusters (fat_info=0xfc000f14, output=0x50009500 <directory_buffer>, start_cluster=2, skip=0, number_of_clusters=4294967295)
    at clusters.c:90
90              read_single_cluster(fat_info, cluster_number, (void *)
(gdb) print *fat_info
$1 = {sectors_per_cluster = 4, bytes_per_sector = 512, first_data_sector = 100, root_directory_sectors = 32, bytes_per_cluster = 2048, block_structure = {
    input_mailbox_id = 46, output_mailbox_id = 47}, fat = 0x50005380 <global_fat>, root = 0x5000d900 <global_root>, bits = 16}
Do you see it? Thank good Lord God for gdb! A good debugger is really an invaluable tool at these times.
The problem is there, right in the number_of_clusters parameter. 4294967295, thats exactly 0xFFFFFFFF (forgive me, I double-checked.) In other words, the highest unsigned 32-bit integer value, and this clearly indicates that we have a bug in the FAT server. It should definitely not try to read 4 billion clusters from the initial ramdisk! And the initial ramdisk shouldn't allow it's receivers to be overflowed this easily. So, bugs in multiple areas of the system was encountered.
A false track: Trying to understand why number_of_clusters had a bogus value
Let's first do the right thing and add checking in the initial_ramdisk, so that you cannot read billions of sectors from a 16 MiB large ramdisk... I started looking at the code but realized that it was already in place:
ipc_block_read_type *ipc_block_read = (ipc_block_read_type *) data;

// Do some boundary checking.
if (ipc_block_read->start_block_number + ipc_block_read->number_of_blocks > ipc_block_info.number_of_blocks)
{
    // FIXME: Should we do the error handling in some other way?
    message_parameter.data = NULL;
    message_parameter.length = 0;
    log_print(&log_structure, LOG_URGENCY_ERROR, "Tried to read out of range.");
}
else
{
    // ...
}
That looks basically sane. The ipc_block_info.number_of_blocks gets initialized from the value of NUMBER_OF_BLOCKS, which gets defined in an auto-generated header file from the ramdisk. It has a value of 32768.
So, back to the debugger again... We saw that number_of_clusters had a huge, garbage-like value. What did it actually put in the ipc_block_read structure then, that made the error appear?
Let's break in read_clusters again, now that we have a working gdb setup with no spurious breakpoints (that is clearly worth celebrating!), and see what we get. I also changed the CFLAGS a bit here, since gdb felt a bit "jumping around" and the code was compiled with -O3 - in other words, with optimization enabled, which can make the debug experience be sub-par. I changed that to -O0 and added the -ggdb3 flag, to "optimize for debugging" rather than for runtime speed, for now.
It was already late at night (little time for chaos this day, unfortunately) so I was getting tired and getting nowhere. I decided to a simple "check if number_of_clusters > current allowed max" check for now, to then try to take it from that angle instead.
That gave me this output instead. Much nicer than a page fault!
So... did I ever find anything more about the root cause for this strange value? Let's backtrack a bit (by looking at the stacktrace) and see the code that called the read_clusters function. The call was coming from a method called fat_directory_read, from a section that looked like this:
read_clusters(
    fat_info,
    &directory_buffer,
    (entry->first_cluster_number_high << 16) +
        entry->first_cluster_number_low,
    0,
    UINT32_MAX
);
Imagine the look of my face when I saw that piece of code. ![]() Okay. So the fact that it got a -1, a.k.a
Okay. So the fact that it got a -1, a.k.a 0xFFFFFFFF or UINT32_MAX was not that strange... In fact, the read_clusters method is actually annotated with a comment like this:
// Read the contents of the given cluster chain, starting from start_cluster + skip, and going number_of_clusters
// or until the end of the chain, depending on which is encountered first. Returns the cluster
// number where we ended, or U32_MAX if we got to the end of the file/directory/whatever.
So, in other words: the fix I did the other night to try and get rid of the page fault, was completely wrong. A false start. (well, not even a start since I'm already hundreds of lines into this blog post...) I reverted that change; luckily, it hadn't been pushed or even committed yet in this case, which made things a bit simpler.
Back on track: looking at the page fault again
Back to that dreadful page fault then... ![]()
I uncommented some nice debug code that we had left in the fat server since the time when it was originally written, which gave me this interesting output on startup:
(I switched from doing the screenshots with VirtualBox to qemu, if you wonder why it looks a bit different from the previous ones all of a sudden.)
This is now very interesting! Why is it reading cluster 0 over and over again?
Being reminded about the danger of improperly written C code
Let's look at the read_clusters code for a while:
uint32_t read_clusters(fat_info_type *fat_info, void *output, uint32_t start_cluster, uint32_t skip, uint32_t number_of_clusters)
{
    uint32_t cluster_number = start_cluster;
    uint32_t clusters_read = 0;

    do
    {
        if (skip > 0)
        {
            skip--;
        }
        else
        {
#ifdef DEBUG
            log_print_formatted (
                &log_structure,
                LOG_URGENCY_DEBUG,
                "Reading cluster number %u",
                cluster_number
            );
#endif
            void *data_buffer = (void *) (
                (uint32_t) output + (
                    clusters_read *
                    fat_info->bytes_per_sector *
                    fat_info->sectors_per_cluster
                )
            );

            read_single_cluster(fat_info, cluster_number, data_buffer);
            clusters_read++;
        }
        cluster_number = get_next_cluster(cluster_number, fat_info->fat, fat_info->bits);
    } while (cluster_number != MAX_uint32_t && clusters_read < number_of_clusters);

    return cluster_number;
}
Now, there are some obvious issues here: the fact that the code reads cluster data into a data buffer without any length restrictions whatsoever is clearly very dangerous, and is the reason for why we are running into these issues right now. I mean, this is a classic buffer overrun. We try to write data into a memory location beyond what has been allocated for us, and we can just consider us lucky enough to have paging enabled and the next page in memory not being mapped (which is why we get the page fault.) It would have been much worse if other memory had randomly been overwritten, which could very well have been the case. Scenarios like this is precisely why C is a dangerous language, and why people have invented things like Rust to fix these shortcomings. (Other languages/environments would be worth mentioning as well, like Java and .NET which both have fixed these issues, even though they do not strictly compete about the same "market share".)
C is a fine language if you use it right, but the problem which the function above shows is that it's far too easy for imperfect humans to make simple mistakes that have severe consequences. It can be laziness, it can be "just trying to get it work first, then make it safe", or other good or bad reasons. It doesn't really matter; the language allows us to make these mistakes and there is very little safety built in to the system. For better and worse, but mostly for worse.
So, the design flaw stated above in combination with the get_next_cluster function returning the same cluster over and over again means that we run into this bug.
For now, I will ignore the design flaw, but I will file a GitHub issue about it for later: chaos#105. You know, for a rainy day or something... ![]()
The FAT data seems to be messed up - but why?
I think I will want to step into get_next_cluster now. It seems like the FAT table is pretty messed up, as if we have not been able to read it properly from the initial_ramdisk server or something like that.
Breakpoint 1, get_next_cluster (cluster_number=2, fat=0x480073a0 <global_fat>, bits=16) at clusters.c:13
13  {
(gdb) step
14      switch (bits)
(gdb)
36              fat16_type *fat16 = fat;
(gdb)
37              uint32_t new_cluster_number = fat16[cluster_number];
(gdb)
39              if (new_cluster_number >= FAT16_END_OF_CLUSTER_CHAIN)
(gdb) print new_cluster_number
$1 = 0
Hmm, okay. So cluster 2 refers to cluster zero as its "next cluster". That's a bit weird. What does the rest of fat16 look like?
0x480073a0 <global_fat>:    0x00000000  0x00000000  0x00000000  0x00000000
0x480073b0 <global_fat+16>: 0x00000000  0x00000000  0x00000000  0x00000000
0x480073c0 <global_fat+32>: 0x00000000  0x00000000  0x00000000  0x00000000
0x480073d0 <global_fat+48>: 0x00000000  0x00000000  0x00000000  0x00000000
0x480073e0 <global_fat+64>: 0x00000000  0x00000000  0x00000000  0x00000000
0x480073f0 <global_fat+80>: 0x00000000  0x00000000  0x00000000  0x00000000
0x48007400 <global_fat+96>: 0x00000000  0x00000000  0x00000000  0x00000000
0x48007410 <global_fat+112>:    0x00000000  0x00000000  0x00000000  0x00000000
0x48007420 <global_fat+128>:    0x00000000  0x00000000  0x00000000  0x00000000
0x48007430 <global_fat+144>:    0x00000000  0x00000000  0x00000000  0x00000000
0x48007440 <global_fat+160>:    0x00000000  0x00000000  0x00000000  0x00000000
0x48007450 <global_fat+176>:    0x00000000  0x00000000  0x00000000  0x00000000
0x48007460 <global_fat+192>:    0x00000000  0x00000000  0x00000000  0x00000000
0x48007470 <global_fat+208>:    0x00000000  0x00000000  0x00000000  0x00000000
0x48007480 <global_fat+224>:    0x00000000  0x00000000  0x00000000  0x00000000
0x48007490 <global_fat+240>:    0x00000000  0x00000000  0x00000000  0x00000000
0x480074a0 <global_fat+256>:    0x00000000  0x00000000  0x00000000  0x00000000
0x480074b0 <global_fat+272>:    0x00000000  0x00000000  0x00000000  0x00000000
0x480074c0 <global_fat+288>:    0x00000000  0x00000000  0x00000000  0x00000000
0x480074d0 <global_fat+304>:    0x00000000  0x00000000  0x00000000  0x00000000
0x480074e0 <global_fat+320>:    0x00000000  0x00000000  0x00000000  0x00000000
0x480074f0 <global_fat+336>:    0x00000000  0x00000000  0x00000000  0x00000000
0x48007500 <global_fat+352>:    0x00000000  0x00000000  0x00000000  0x00000000
0x48007510 <global_fat+368>:    0x00000000  0x00000000  0x00000000  0x00000000
0x48007520 <global_fat+384>:    0x00000000  0x00000000  0x00000000  0x00000000
0x48007530 <global_fat+400>:    0x00000000  0x00000000  0x00000000  0x00000000
I'm not an expert of the FAT file system by any means, but that does clearly not look very correct. ![]() A bunch of zeroes like this more looks like a piece of uninitialized data than a FAT table.
A bunch of zeroes like this more looks like a piece of uninitialized data than a FAT table.
I looked in the detect_fat.c file, and concluded that it had very little (in fact, none at all!) handling of cases when the ipc_send or ipc_receive failed, so I added that. Maybe it's trying to read the global_fat from the initial_ramdisk, but for whatever reason failing and because it doesn't check the return values properly it could be that it just goes on and continues to run, with garbage data... (again, it's too easy to "cheat" with things like this in C which this real-world scenario shows plainly)
With that in place, I still got the page fault on startup. Interesting! I decided to change the reading of the global_fat bit like this:
        memory_set_uint32_t((uint32_t *) &global_fat, 0xDEADBEEF, 16384 / sizeof(uint32_t));
        message_parameter.length = 16384;
        message_parameter.data = &global_fat;

        if (ipc_receive(fat_info->block_structure.input_mailbox_id, &message_parameter, NULL) != IPC_RETURN_SUCCESS)
It would previously initialize the global_fat with zeroes, but I thought it could be better to put a more uncommon value there. And 0xDEADBEEF is a nice hex value, used elsewhere as well, but not yet in chaos. ![]()
Interesting, I still got the same behavior, and it seems to be reading cluster 0 over and over again... Could it be the sending of the cluster from the initial ramdisk that is broken somehow? I have changed it a bit; previously the initial ramdisk was a 1.44 MiB floppy image or something, but it was changed to a 16 MiB image a while ago to be able to fit in more servers (and hopefully Quake some day. ![]() ) So, the preconditions are somewhat different to what they used to be, but still... Very strange indeed.
) So, the preconditions are somewhat different to what they used to be, but still... Very strange indeed.
Looking at data being sent from the initial_ramdisk server
I put a breakpoint at the ipc_send line in initial_ramdisk.c, to be able to look at the data being sent to the FAT server. It looked completely sane:
(gdb) x/500b message_parameter->data
0x50001270 <ramdisk>:   0xeb    0x3c    0x90    0x6d    0x6b    0x66    0x73    0x2e
0x50001278 <ramdisk+8>: 0x66    0x61    0x74    0x00    0x02    0x04    0x04    0x00
0x50001280 <ramdisk+16>:    0x02    0x00    0x02    0x00    0x80    0xf8    0x20    0x00
0x50001288 <ramdisk+24>:    0x20    0x00    0x40    0x00    0x00    0x00    0x00    0x00
0x50001290 <ramdisk+32>:    0x00    0x00    0x00    0x00    0x80    0x00    0x29    0x20
0x50001298 <ramdisk+40>:    0xf5    0x0c    0xf5    0x4e    0x4f    0x20    0x4e    0x41
0x500012a0 <ramdisk+48>:    0x4d    0x45    0x20    0x20    0x20    0x20    0x46    0x41
This is not a full sector of 0x00 which I was fearing. I continued the session and let it break again on the next ipc_send call:
(gdb) x/500b message_parameter->data
0x50001470 <ramdisk+512>:   0x00    0x00    0x00    0x00    0x00    0x00    0x00    0x00
0x50001478 <ramdisk+520>:   0x00    0x00    0x00    0x00    0x00    0x00    0x00    0x00
0x50001480 <ramdisk+528>:   0x00    0x00    0x00    0x00    0x00    0x00    0x00    0x00
0x50001488 <ramdisk+536>:   0x00    0x00    0x00    0x00    0x00    0x00    0x00    0x00
0x50001490 <ramdisk+544>:   0x00    0x00    0x00    0x00    0x00    0x00    0x00    0x00
Now this if finally interesting! A sector of zeroes; if I let it continue now it will probably give me these "reading cluster number 0" lines.
Of course, this is again a symptom of an underlying problem; the FAT server performs far too little error checking and validation of data it reads, which is why it just keeps going even when it has read this completely broken FAT sector from the initial ramdisk. (Man, software engineering is hard! You can get it working in the "sunny day" cases fairly easily, but making it really work and have proper error handling etc... that takes a lot of effort!)
I looked a bit more to see which blocks it was trying to read. The first call looked like this:
(gdb) p *ipc_block_read
$1 = {start_block_number = 0, number_of_blocks = 1}
The subsequent like this:
(gdb) p *ipc_block_read
$2 = {start_block_number = 1, number_of_blocks = 32}

(gdb) p *ipc_block_read
$3 = {start_block_number = 68, number_of_blocks = 32}

(gdb) p *ipc_block_read
$4 = {start_block_number = 100, number_of_blocks = 4}

(gdb) p *ipc_block_read
$5 = {start_block_number = 92, number_of_blocks = 4}

(gdb) p *ipc_block_read
$6 = {start_block_number = 92, number_of_blocks = 4}

(gdb) p *ipc_block_read
$7 = {start_block_number = 92, number_of_blocks = 4}

...
So... The reading of 32 blocks starting from block number 1 gives a very weird result. The block size, as given from ipc_block_info, should be 512 bytes in this case:
(gdb) p ipc_block_info
$10 = {block_size = 512, number_of_blocks = 32768, writable = 1, readable = 1, label = "Initial ramdisk 0.0.1", '\000' <repeats 42 times>}
Investigating the data in the actual ramdisk image
Let's look at the ramdisk image, shall we (using the tool bvi):
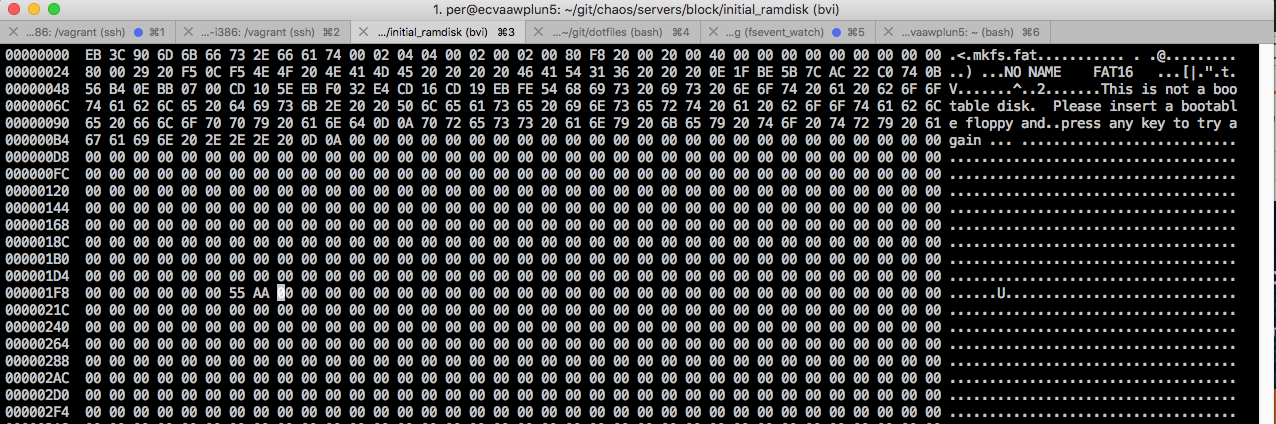
The cursor position is exactly at 0x200, i.e. the second sector = block number 1 (zero-indexed). And it does indeed look like it's pretty much zeroed out...
So, where is this call coming from? I think I'll need to put a breakpoint in the fat server, where it's reading the file, to track down the ipc_send calls from that end. Since the initial_ramdisk is running in its own address space as a separate process, I can unfortunately not just look at the call stack... (I can see very clear reasons why multi-process based operating systems aren't more popular than they are, to be honest. They are a pain to debug sometimes; monolithic systems like Linux have a much simpler architecture.)
I started debugging this with a breakpoint in fat_file_get_info, and then something wonderful happened. I stepped through the code for a while, and found myself with the debugger at one half of the screen, and navigating through the code ("go to definition") in the editor at the other half of the screen. The IDE experience in that sense was nice! I could look at the program while it was running in the terminal, and jump around in the code easily in the other window - without the computer being slow, sluggish etc. which it often feels otherwise these days... Anyway, it felt nice!
I kept digging. I learned that a FAT directory entry is 32 bytes long, thank you for that GDB!
(gdb) print sizeof(fat_entry_type)
$7 = 32
By looking at the hex dump of the fat_entry data, it's quite clear that this FAT root directory contains one single entry (which makes complete sense, given that it is supposed to contain a single config folder. Let's print it out as strings and we should see it ourselves!
get_entry_by_name (fat_entry=0x4800b5a0 <directory_buffer>, name=0x7d7001 "CONFIG") at get_entry_by_name.c:15
15  {
(gdb) x/8xs fat_entry
0x4800b5a0 <directory_buffer>:  "CONFIG     \020\b"
0x4800b5ae <directory_buffer+14>:   "\270\212MKMK"
0x4800b5b5 <directory_buffer+21>:   ""
0x4800b5b6 <directory_buffer+22>:   "\270\212MK\002"
0x4800b5bc <directory_buffer+28>:   ""
0x4800b5bd <directory_buffer+29>:   ""
0x4800b5be <directory_buffer+30>:   ""
0x4800b5bf <directory_buffer+31>:   ""
The entry right after is completely empty as can be seen here:
(gdb) x/32xb &fat_entry[1]
0x4800b5c0 <directory_buffer+32>:   0x00    0x00    0x00    0x00    0x00    0x00    0x00    0x00
0x4800b5c8 <directory_buffer+40>:   0x00    0x00    0x00    0x00    0x00    0x00    0x00    0x00
0x4800b5d0 <directory_buffer+48>:   0x00    0x00    0x00    0x00    0x00    0x00    0x00    0x00
0x4800b5d8 <directory_buffer+56>:   0x00    0x00    0x00    0x00    0x00    0x00    0x00    0x00
I continued stepping through the code, things looked basically sane all the way until it should read the clusters, using this code:
            read_clusters(
                fat_info,
                &directory_buffer,
                (entry->first_cluster_number_high << 16) +
                    entry->first_cluster_number_low,
                0,
                UINT32_MAX
            );
The entry also looked fine; in this case, the directory data would be located at the second cluster, from what I could tell.
(gdb) print *entry
$16 = {name = "CONFIG\000 ", extension = "\000  ", read_only = 0 '\000', hidden = 0 '\000', system = 0 '\000', volume_id = 0 '\000', directory = 1 '\001',
  archive = 0 '\000', reserved = 0 '\000', nt_reserved = 8 '\b', creation_hundreds = 0 '\000', creation_time = {hours = 24, minutes = 21, seconds = 17},
  creation_date = {year = 77, month = 6, day = 9}, access_date = {year = 77, month = 6, day = 9}, first_cluster_number_high = 0, update_time = {
    hours = 24, minutes = 21, seconds = 17}, update_date = {year = 77, month = 6, day = 9}, first_cluster_number_low = 2, file_size = 0,
  next = 0x4800b5c0 <directory_buffer+32> ""}
A closer look at the FAT directory entries
I continued a while more, stepping in the fat server and eventually switching over to place a breakpoint in the initial_ramdisk server for the reading of block 100. This also looked pretty fine actually. I placed a breakpoint right at the end of the reading inside initial_ramdisk.c, line 95 and printed the contents of the data it was returning to the caller:
(gdb) x/30xs message_parameter->data
0x5000da70 <ramdisk+51200>: ".          \020"
0x5000da7d <ramdisk+51213>: ""
0x5000da7e <ramdisk+51214>: "\270\212MKMK"
0x5000da85 <ramdisk+51221>: ""
0x5000da86 <ramdisk+51222>: "\270\212MK\002"
0x5000da8c <ramdisk+51228>: ""
0x5000da8d <ramdisk+51229>: ""
0x5000da8e <ramdisk+51230>: ""
0x5000da8f <ramdisk+51231>: ""
0x5000da90 <ramdisk+51232>: "..         \020"
0x5000da9d <ramdisk+51245>: ""
0x5000da9e <ramdisk+51246>: "\270\212MKMK"
0x5000daa5 <ramdisk+51253>: ""
0x5000daa6 <ramdisk+51254>: "\270\212MK"
0x5000daab <ramdisk+51259>: ""
0x5000daac <ramdisk+51260>: ""
0x5000daad <ramdisk+51261>: ""
0x5000daae <ramdisk+51262>: ""
0x5000daaf <ramdisk+51263>: ""
0x5000dab0 <ramdisk+51264>: "SERVERS    \020\b"
0x5000dabe <ramdisk+51278>: "\270\212MKMK"
0x5000dac5 <ramdisk+51285>: ""
0x5000dac6 <ramdisk+51286>: "\270\212MK\003"
0x5000dacc <ramdisk+51292>: ""
0x5000dacd <ramdisk+51293>: ""
0x5000dace <ramdisk+51294>: ""
0x5000dacf <ramdisk+51295>: ""
0x5000dad0 <ramdisk+51296>: ""
0x5000dad1 <ramdisk+51297>: ""
0x5000dad2 <ramdisk+51298>: ""
This might not be obvious for everyone, but I see three file entries here:
-
.- i.e. the current working directory. -
..- the parent directory. -
SERVERS- the folder we're looking for.
It felt like I was getting closer here. I switched back the file being debugged to servers/file_system/fat/fat, and meticulously stepped one instruction at a time into the kernel (since I could only have the symbols for one single ELF image loaded at a time, I couldn't just step out of the function - GDB knew too little about the code being debugged in this case) and hopefully, eventually back to the 0x4800xxxx address space...
(gdb) stepi
0x50001178 in ?? ()
(gdb) stepi
0x5000117c in ?? ()
(gdb)
0x5000117d in ?? ()
(gdb)
0x5000117e in ?? ()
(gdb)
0x51001610 in ?? ()
(gdb)
0x51001614 in ?? ()
(gdb)
0x51001618 in ?? ()
(gdb)
0x51001619 in ?? ()
(gdb)
0x5100161a in ?? ()
(gdb)
0x0010a430 in ?? ()
(gdb)
0x0010a431 in ?? ()
(many lines omitted) This was extremely tedious, but I felt I was so close now that I didn't want to let go of it! Yeah, I might be able to just restart and get back to the current state, but... I didn't want to do that.
It never seemed to get done. Weird! Maybe the fact that the debugger was attached was preventing the interrupts from being raised or something. I gave up for now and just let it continue, probably crashing.
Crashing it did. Let's reboot the VM and see if we can get back into this state... We see that it managed to read the root folder, then the config folder also seemingly.
I quite easily managed to get it to the state where it was crashed; I was now back into the middle of the read_clusters function again. I saw that it was calling a method named get_next_cluster; it is mentioned earlier in this blog post. My suspicion right now is that it only works properly with FAT12 volumes; since that's all we've been testing it with, and we don't have any unit or integration tests that validates it works correctly on both FAT12 and FAT16... we can't really expect it to work that well, can we? (This is a reminder to myself and everyone else: don't skip writing tests. You are only hurting yourself and your peers in the long run. You believe you are saving time right now, but you're not.)
Finding a bug in the FAT16 implementation: incorrect assumptions
I continued the digging and came back to the global_fat, also mentioned quite a lot earlier here. I started looking into how that structure was being populated. Something like this:
        message_parameter.data = &ipc_block_read;
        message_parameter.length = sizeof(ipc_block_read_type);

        ipc_block_read.start_block_number = 1;
        ipc_block_read.number_of_blocks = bios_parameter_block->fat_size_16;

        if (ipc_send(fat_info->block_structure.output_mailbox_id, &message_parameter) != IPC_RETURN_SUCCESS)
        {
            // ...
Okay, so exactly here is the problem. The start block number is 1. We already saw, in the hexdump a while ago, that the second sector in this volume contains all zeroes. So maybe the location of the first FAT cannot be hardwired like that always? I looked at a document describing the FAT format:
1.1 Layout
First the boot sector (at relative address 0), and possibly other stuff. Together these are the Reserved Sectors. Usually the boot sector is the only reserved sector.
Then the FATs (following the reserved sectors; the number of reserved sectors is given in the boot sector, bytes 14-15; the length of a sector is found in the boot sector, bytes 11-12).
That's interesting. Let's look at bytes 14-15 in the boot sector again (highlighted with stars below):
                                                    ** **
00000000  EB 3C 90 6D 6B 66 73 2E 66 61 74 00 02 04 04 00 02 00 02 00 80 F8 20 00 20 00 40 00 00 00 00 00 00 00 00 00 .<.mkfs.fat........... . .@.........
00000024  80 00 29 20 F5 0C F5 4E 4F 20 4E 41 4D 45 20 20 20 20 46 41 54 31 36 20 20 20 0E 1F BE 5B 7C AC 22 C0 74 0B ..) ...NO NAME    FAT16   ...[|.".t.
00000048  56 B4 0E BB 07 00 CD 10 5E EB F0 32 E4 CD 16 CD 19 EB FE 54 68 69 73 20 69 73 20 6E 6F 74 20 61 20 62 6F 6F V.......^..2.......This is not a boo
0000006C  74 61 62 6C 65 20 64 69 73 6B 2E 20 20 50 6C 65 61 73 65 20 69 6E 73 65 72 74 20 61 20 62 6F 6F 74 61 62 6C table disk.  Please insert a bootabl
00000090  65 20 66 6C 6F 70 70 79 20 61 6E 64 0D 0A 70 72 65 73 73 20 61 6E 79 20 6B 65 79 20 74 6F 20 74 72 79 20 61 e floppy and..press any key to try a
000000B4  67 61 69 6E 20 2E 2E 2E 20 0D 0A 00 00 00 00 00 00 00 00 00 00 00 00 00 00 00 00 00 00 00 00 00 00 00 00 00 gain ... ...........................
Heureka! We have it! The problem is that the code made stupid, incorrect assumptions that might have worked on 1.44 MiB floppy images years ago, being formatted with the mtools mformat program or similar. Anyway, it is a bad and stupid assumption and we should fix that now, to sort out the bug.
Illegal page fault in the boot server
After fixing that, I ran into the next problem.
Isn't life great to you sometimes? ![]() I looked at the stack trace - now it seems to be crashing later on:
I looked at the stack trace - now it seems to be crashing later on:
400013cf <parse_program_list>:

static unsigned int parse_program_list(unsigned int file_size)
{
400013cf:       83 ec 10                sub    $0x10,%esp
    unsigned int number_of_programs = 0;
400013d2:       c7 44 24 0c 00 00 00    movl   $0x0,0xc(%esp)
400013d9:       00
    programs[number_of_programs++] = &program_list_buffer[0];
400013da:       8b 44 24 0c             mov    0xc(%esp),%eax
400013de:       8d 50 01                lea    0x1(%eax),%edx
400013e1:       89 54 24 0c             mov    %edx,0xc(%esp)
400013e5:       8b 15 40 44 00 40       mov    0x40004440,%edx
400013eb:       89 14 85 60 44 00 40    mov    %edx,0x40004460(,%eax,4)

    // Convert the LF-terminated file into a buffer o NUL-terminated strings.
    for (unsigned int i = 1; i < file_size; i++)
400013f2:       c7 44 24 08 01 00 00    movl   $0x1,0x8(%esp)
400013f9:       00
400013fa:       eb 52                   jmp    4000144e <parse_program_list+0x7f>
    {
        if (program_list_buffer[i] == '\n')
400013fc:       8b 15 40 44 00 40       mov    0x40004440,%edx
40001402:       8b 44 24 08             mov    0x8(%esp),%eax
40001406:       01 d0                   add    %edx,%eax
40001408:       0f b6 00                movzbl (%eax),%eax
4000140b:       3c 0a                   cmp    $0xa,%al
4000140d:       75 3a                   jne    40001449 <parse_program_list+0x7a>
Let's make a new breakpoint at parse_program_list and see what we get; perhaps we even have some file content? That would be completely awesome!
(gdb) break parse_program_list
Breakpoint 1 at 0x400013cf: file boot.c, line 168.
(gdb) cont
Continuing.

Breakpoint 1, parse_program_list (file_size=1073762304) at boot.c:168
168 {
(gdb) info locals
number_of_programs = 1073746895
Hmm. ![]() I don't think the file is really one gigabyte large. Something has corrupted things earlier on. Maybe it's again a case of lack of proper error handling. Let's go back to the
I don't think the file is really one gigabyte large. Something has corrupted things earlier on. Maybe it's again a case of lack of proper error handling. Let's go back to the read_program_list method and debug that one a bit more.
    if (file_get_info(&vfs_structure, &directory_entry) != FILE_RETURN_SUCCESS)
    {
        log_print(&log_structure, LOG_URGENCY_ERROR, STARTUP_FILE " not found.");
        return FALSE;
    }
The directory_entry looks sane after file_get_info. Both the path name and the size field has the expected values, which is nice!
(gdb) p directory_entry
$3 = {path_name = "\000CONFIG\000SERVERS\000BOOT\000STARTUP\000\000STARTUP", '\000' <repeats 771 times>..., success = 1, type = 1, time = 4294967296,
  size = 16}
Hmm, this looked weird:
(gdb) p program_list_buffer
$4 = 0x676f7270 <error: Cannot access memory at address 0x676f7270>
(gdb) p *program_list_buffer
Cannot access memory at address 0x676f7270
Either it's a problem with the debugging session or I'm on to something here for real. I noted that we had a dangerous memory allocation where the return value was never checked:
memory_allocate((void **) &program_list_buffer, directory_entry.size);
However, if this allocation fails, and the pointer is never initialized, wouldn't it crash also in the VM? Anyway, I fixed it now so that we verify that the allocation actually was successful before continuing.
It would still unfortunately crash, but now I saw something interesting:
CR2: 0x676F7271
Do you see it? This value is incredibly close to 0x676f7270 listed above.
The EIP address seemed to be in start_programs now during the crash. I decided to comment out that call completely and reboot. It would still crash, unfortunately. I moved the boot server to a unique virtual address to be able to get a better gdb experience and avoid these spurious breakpoints from other processes that are so annoying.
Finding a clear bug: overwriting a pointer variable when reading from the file
Ahh.... THIS was an annoying one:
    if (file_read(&vfs_structure, handle, directory_entry.size, &program_list_buffer) != FILE_RETURN_SUCCESS)
    {
        log_print(&log_structure, LOG_URGENCY_ERROR, "Failed reading from " STARTUP_FILE);
        return FALSE;
    }
This is wrong. The program_list_buffer is already a pointer, so &program_list_buffer will read the file into the variable that is the pointer instead of the memory being pointed to. A seemingly small but very significant difference... Strange that it didn't crash completely, but we must have been "lucky" enough to not overflow the physical pages actually allocated and mapped for this process.
Things like this make you realize why people think C is such a bad language. Yes, it is indeed. It's beautiful in certain areas, but horrible in others. The existence of void * is one such thing; it's a horrible pointer type that can be cast to/from other pointer types without warnings or errors. But, in this case you could actually argue that file_read shouldn't take a void * as its argument but rather uint8_t *. That way, we would have get a compilation warning, since char ** can be silently converted to void * but not to uint8_t *. I think we'll change it now anyway.
(I wondered whether this was a regression introduced in my recent refactoring of the boot server code, so I looked at the original code. The code seemed completely wrong, so... I'm not so convinced yet.)
After the change, this is what you get now when compiling:
Compiling boot...
    boot.c boot.c: In function 'read_program_list':
boot.c:160:65: error: passing argument 4 of 'file_read' from incompatible pointer type [-Werror=incompatible-pointer-types]
     if (file_read(&vfs_structure, handle, directory_entry.size, &program_list_buffer) != FILE_RETURN_SUCCESS)
                                                                 ^
In file included from /vagrant/servers/../libraries/file/file.h:12:0,
                 from config.h:15,
                 from boot.c:7:
/vagrant/servers/../libraries/file/functions.h:15:20: note: expected 'uint8_t * {aka unsigned char *}' but argument is of type 'char **'
 extern return_type file_read(ipc_structure_type *vfs_structure, file_handle_type file_handle, unsigned int length, uint8_t *buffer);
Much better like that! And you know what: after fixing that final bug, this is what we have now:
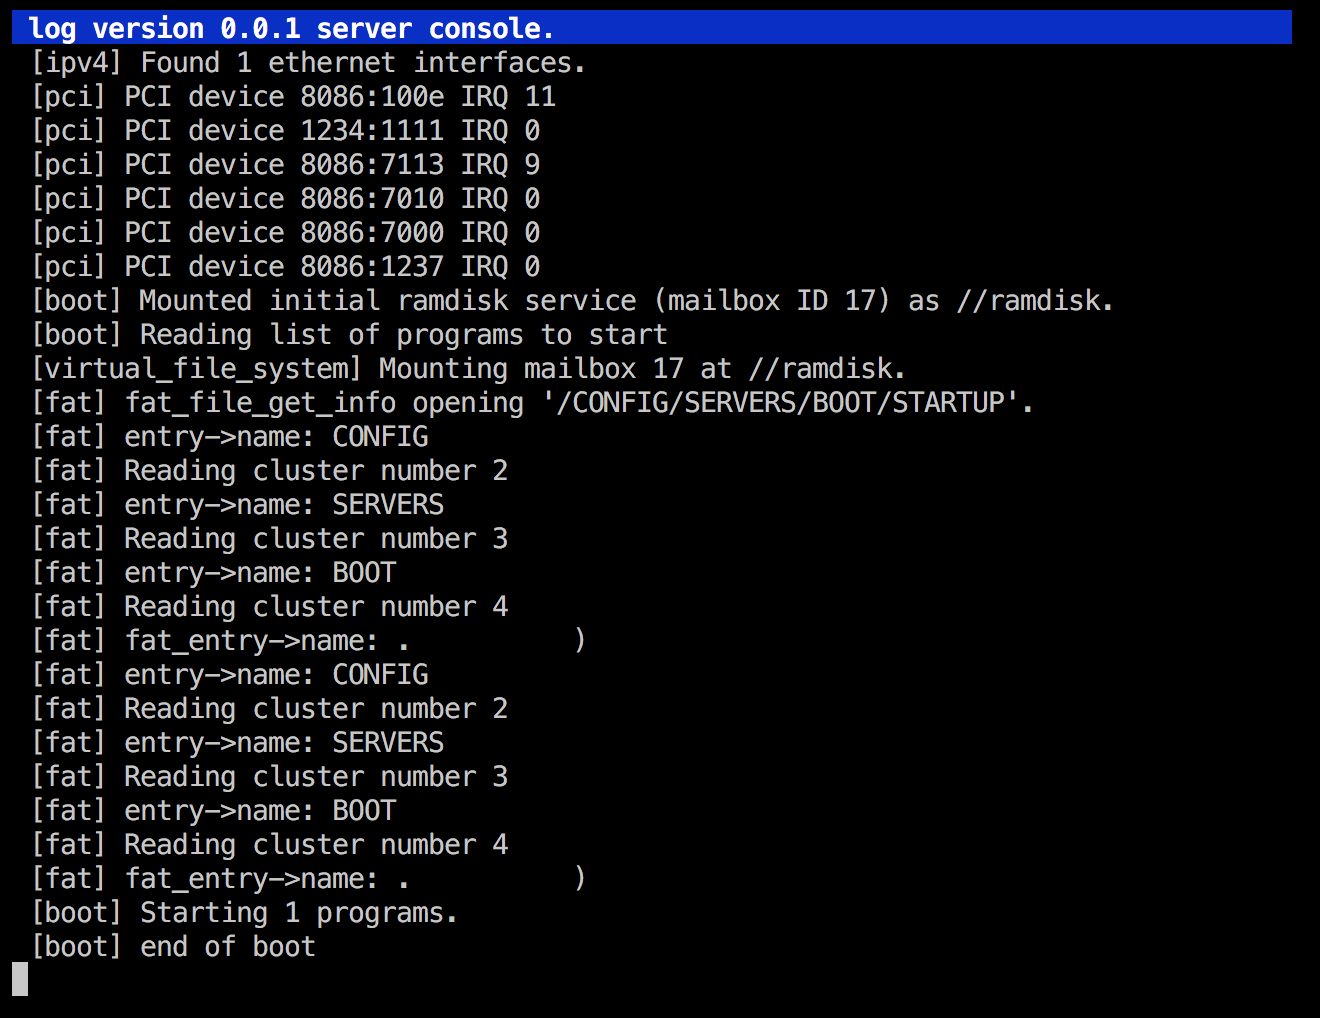
I think we're really getting there now. Let's disable the excessive logging, and also take back the "start programs" code that is uncommented now and see what we'll get.
A new error message: programs/cluido could not be accessed
This is what the startup screen looked like:
Much better than before! This might even be a correct error, since the cluido binary is never copied into the ramdisk. Let's add that code (in the programs/Rakefile) and see what we will get!
Strangely enough, it did not make any difference; the files are now there in the ramdisk but I still get the same output on bootup:
vagrant@debian-9rc1-i386:/vagrant$ mdir -s u:
 Volume in drive U has no label
 Volume Serial Number is 00D4-080D
Directory for U:/

config       <DIR>     2017-10-29   5:32
programs     <DIR>     2017-10-29   5:32
        2 files                   0 bytes

Directory for U:/config

.            <DIR>     2017-10-29   5:32
..           <DIR>     2017-10-29   5:32
servers      <DIR>     2017-10-29   5:32
        3 files                   0 bytes

Directory for U:/config/servers

.            <DIR>     2017-10-29   5:32
..           <DIR>     2017-10-29   5:32
boot         <DIR>     2017-10-29   5:32
        3 files                   0 bytes

Directory for U:/config/servers/boot

.            <DIR>     2017-10-29   5:32
..           <DIR>     2017-10-29   5:32
startup             16 2017-10-29   5:32
        3 files                  16 bytes

Directory for U:/programs

.            <DIR>     2017-10-29   5:32
..           <DIR>     2017-10-29   5:32
cluido          211260 2017-10-29   5:32
        3 files             211 260 bytes

Total files listed:
       14 files             211 276 bytes
                         16 502 784 bytes free
Unintentionally case sensitive FAT implementation?
I wonder if the problem is with the casing, and the previous theory about the FAT code being case sensitive right now being correct? Let's verify that by changing the boot server back to read the startup script with lowercase letters and see what happens on bootup.
Indeed, that seems to be it. I filed a bug about it - chaos#107; it seems to be mtools that have changed their semantics since we wrote our code almost 20 years ago... ![]()
After switching the boot server back to uppercase, and also fixing the cluido path in the startup script, I got this:
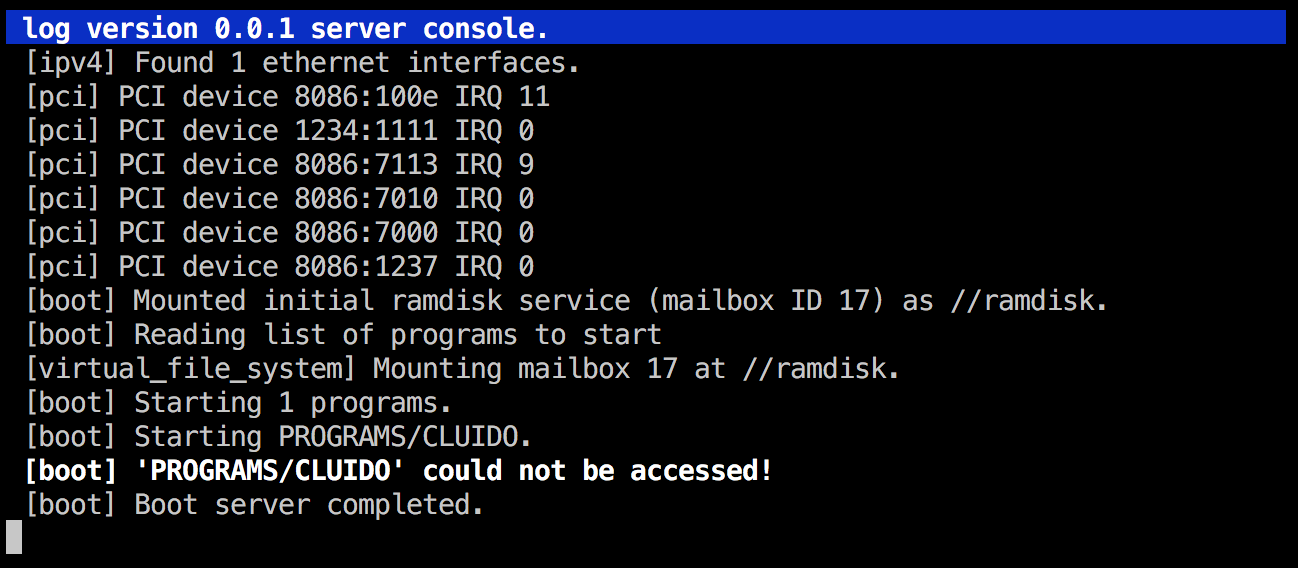
Hmmm.... What new bug do we have now? I got an idea: could it be that the file names in the startup script are currently expected to be a fully qualified path, i.e. //ramdisk/PROGRAMS/CLUIDO. Let's try with that!
Another illegal page fault in the boot server
That gave me this on startup:
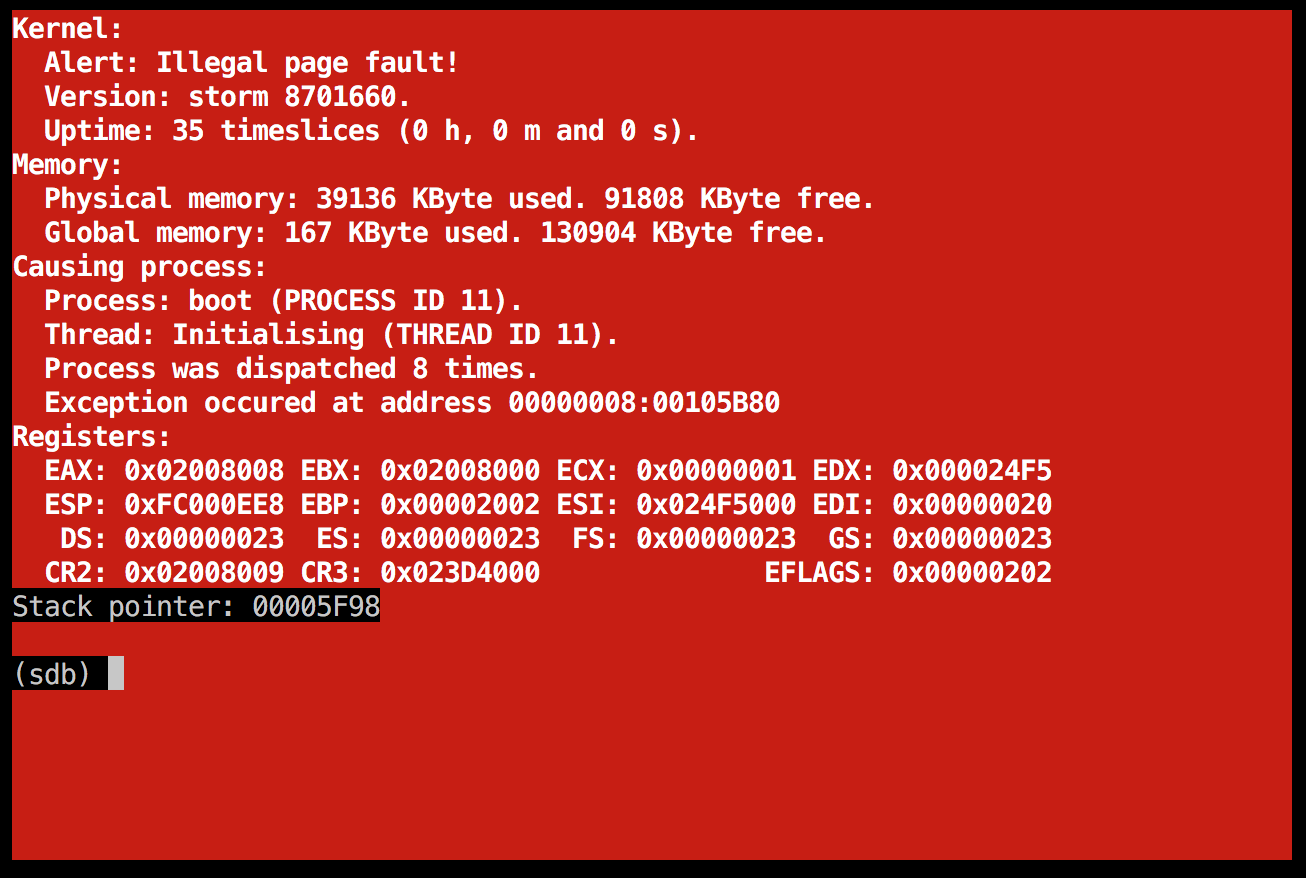
![]() As strange as it may seem, I actually consider this some progress. It behaves differently than before, so it probably got a bit longer this time, running into some new bug...
As strange as it may seem, I actually consider this some progress. It behaves differently than before, so it probably got a bit longer this time, running into some new bug...
The code that was failing looked like this (slightly reformatted), in memory_virtual_map_real:
    page_table = (page_table_entry *) (BASE_PROCESS_PAGE_TABLES + (index * SIZE_PAGE));

    // Which entry in the page table to modify.
    index = (virtual_page + counter) % 1024;

    // Set up a new page table entry.
    page_table[index].present = 1;
    page_table[index].flags = flags;
    page_table[index].accessed = 0;
    page_table[index].dirty = 0;
    page_table[index].zero = 0;
    page_table[index].available = 0;
    page_table[index].page_base = physical_page + counter;
Going back into gdb once more
It wasn't so easy to get anything immediate out of this; I think I'll need to re-launch the debugger, this time breaking inside the boot server right at the place where it starts launching the programs.
Interesting; doing so made me find the failing line very quickly. boot.c around line 223 looked like this:
        log_print_formatted(&log_structure, LOG_URGENCY_DEBUG,
                            "Allocating %u bytes for %s.",
                            directory_entry.size, programs[i]);

        memory_allocate((void **) buffer_pointer, directory_entry.size);
directory_entry.size was 211260, that I had already seen in the debugger. But why was the memory allocation failing? This seemed to indicate some very annoying kernel bug. Maybe we should just port the servers to run on top of Linux instead, as I have been thinking. ![]() Debugging kernel bugs can be extremely painful and demotivating sometimes... If we would be running on top of a minimal, stripped-down Linux kernel (with all file systems, device drivers etc disabled), we wouldn't have to waste time trying to debug things like this.
Debugging kernel bugs can be extremely painful and demotivating sometimes... If we would be running on top of a minimal, stripped-down Linux kernel (with all file systems, device drivers etc disabled), we wouldn't have to waste time trying to debug things like this.
I remembered reading something somewhere about memory deallocation being disabled, and if it is enabled the system can be unstable. I looked and found that flag in memory_global.c in the kernel; however, it was disabled so it can't really be the problem here.
I had no better idea than to step into the kernel and looking at the problem more in detail... I quite easily managed to step into the kernel code (file storm/x86/storm in gdb to switch the current executable, then stepi until I managed to get into the kernel, PL0 mode.
memory_allocate (address=0xffffff7c, pages=52, cacheable=1) at memory.c:30
30  {
As indicated previously, the allocation of memory was working:
memory_physical_allocate(&physical_page, pages, "User-level allocation");
...but the actual mapping of this memory was causing the problems:
memory_virtual_map(page_number, physical_page, pages, flags);
I noted while stepping through the kernel code that the stepping seemed "jumping" around, so now was the time to enable -O0 here also, i.e. disable compiler optimizations since they complicate debugging. I also tweaked some of the code to make it easier to understand in the gdb context (note to my dear readers: do not overload the meaning of a variable inside a method to mean different things, even though it can feel like a handy micro-optimization. It makes it harder to watch the value changing while debugging, for example.)
This is btw when conditional breakpoints come in handy:
(gdb) break memory_virtual_allocate if pages = 52
Breakpoint 4 at 0x1055bd: file memory_virtual.c, line 564.
(gdb) cont
Continuing.

Breakpoint 4, memory_virtual_allocate (page_number=0xfc000e64, pages=52) at memory_virtual.c:564
564 {
I could then just finish that method and get out to the calling method (after a mutex had been acquired - that's the reason why I couldn't just put the breakpoint in the outer method. Acquiring the mutex while the debugger is attached seemed to be difficult, which is reasonable since it probably requires interrupts to be enabled etc.)
The prey shifting: now the console server is doing it instead?
Even so, things were behaving strangely; maybe my recently introduced refactoring had changed the circumstances in such a way that things broke in a different way now. If you look carefully at the next screenshot, you can see that the "prey" that I am currently hunting in my "bug hunt" has shifted, from being the boot server to now be the console server all of a sudden!
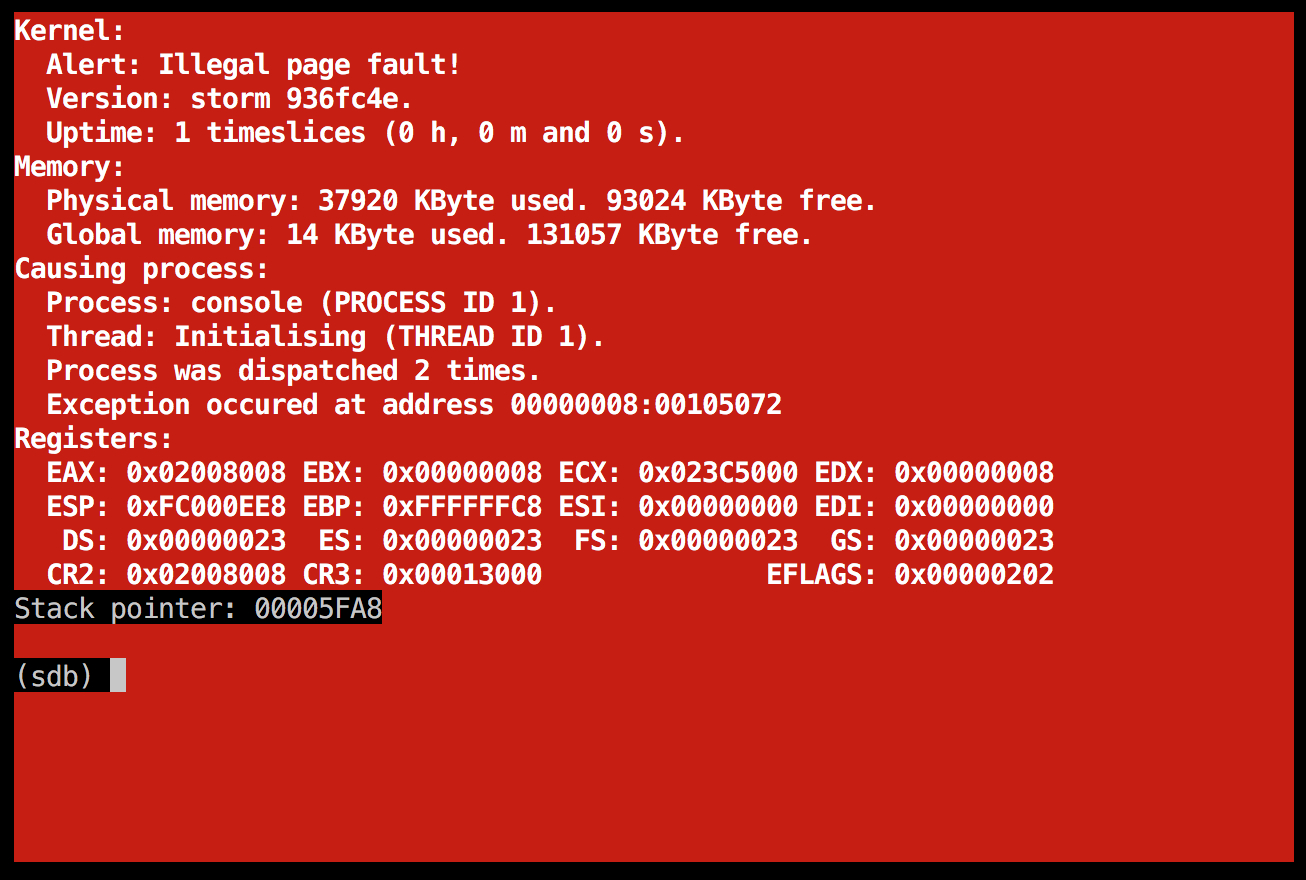
An interesting detail I noted after taking a slight pause and editing the blog post and then looking at the screenshots, is that the address that is mentioned here is strikingly similar to the error in the boot server a short while ago. That is, the CR2 address (i.e. the memory address that caused the page fault):
- In the first screenshot:
0x02008009(in the boot server) - In the second screenshot:
0x02008008(in the console server)
That's interesting. I looked at the virtual memory overview (and did a bunch of cleanups of it at the same time, to make it more readable.) The address in question is indeed part of the process' page tables.
The page table structures are the lower-level data structure for the virtual memory subsystem of the Intel x86 architecture. Above them comes the page directory. A single page directory (4 KiB) contains 1024 entries, which are references to the lower-level page tables. Each page table in turns contains 1024 entries to individual 4 Kib pages. So this structure can, in its simplest (non-PAE/etc) form refer to the full 32-bit of address space that the Intel x86 architecture provides, like this: 1024 page directory entries * 1024 page table entries * 4096 bytes per page = 2 ** 32, i.e. 4 294 967 296.
Okay, so that's the theory. But why is it failing now? And why always on the exact same page?
A crazy thought: could it be that user-level allocation of memory is completely broken in its current state? That any allocation of memory from a user-level process is failing? That could explain why it happened first in one server, and then in another.
Let's just put a breakpoint at system_call_memory_allocate and see if it will even run successfully once.
That seems to work fine, and the address being returned is not even in the ballpark for these failing addresses:
Breakpoint 1, system_call_memory_allocate (address=0x40009644, pages=1, cacheable=1) at system_call.c:96
96  {
(gdb) print *address
$6 = (void *) 0x0
(gdb) next
97      return memory_allocate(address, pages, cacheable);
(gdb) print *address
$7 = (void *) 0x0
(gdb) next
98  }
(gdb) print *address
$8 = (void *) 0x7d5000
Staring at the memory_virtual_map_real method once more
Hmm. I have an idea again... An engineer with an idea is a dangerous thing. Could it be some form of cache, so that even when we allocate a new page and set it up in the virtual memory structures, the CPU doesn't properly invalidate the page directory cache? And therefore uses old information on its content, where the page table in question is not mapped.
Tried that, didn't seem to help. (I first invalidated the page table, didn't help, then the page directory instead, which didn't seem to make a tiny bit of a difference either.)
What I'd like now is to be able to see the exact values of everything at the moment of the crash.
Hmmm, I have another idea. Since I know the exact address it is failing on, maybe I can just set a breakpoint there, right in the middle of the method, with a condition that the page_table variable should have the exact right address:
(gdb) break memory_virtual.c:378 if page_table = 0x02008000
Breakpoint 1 at 0x105586: file memory_virtual.c, line 378.
(gdb)
That triggered the breakpoint indeed, but for other mappings unfortunately, and when I just continued the debugging the kernel crashed in a completely different location?!? Kernel debugging is surely "fun" sometimes...
I decided to try VirtualBox also since I had only been running qemu now lately. Luckily (in a way), it crashed at the exact same CR2 address as qemu, which is good - predictable bugs that always fail in the same way are always much more pleasant than completely unpredictable bugs...
I eventually managed to hit it, using this condition:
(gdb) break memory_virtual.c:378 if page_table == 0x02008000 && page_table_index == 2
Breakpoint 6 at 0x105586: file memory_virtual.c, line 378.
(gdb) cont
Continuing.
(I noted that gdb and/or qemu tended to get a lot slower on multiple-condition breakpoints. Or maybe it's because of breakpoints in general; this part of the code is heavily used all over the place, so it could very well be why I'm seeing this slowdown.)
Getting closer and closer: what is the root cause of this page fault?
It's always nice to have a proper debug session where we can look closely at the state, inspect variables etc. So this is what it looks like in gdb:
(gdb) info locals
page_directory_index = 8
page_table_index = 2
page_table = 0x2008000
counter = 0
(gdb) print process_page_directory
$2 = (page_directory_entry_page_table *) 0x1000
(gdb) print/x process_page_directory[8]
$3 = {present = 0x1, flags = 0x3, accessed = 0x1, zero = 0x0, page_size = 0x0, global = 0x0, available = 0x0,
      page_table_base = 0x23d4}
Hmm, that's interesting. Maybe I'm just mistaken but that page_table_base indeed looks fishy. Can that really be a reference to 0x2008000? I don't really remember the format of the page directory entries (PTE) now, so I had to look it up in the code again. The OSDev wiki page is also a useful source of information here.
Reading up on the subject indicates that this PTE indeed refers to 0x23d4000 which seems to confirm my suspicion.
Trying to access that memory seems to fail though. And, the only memory being mapped in the 0x200x000 series seems to be 0x2001000.
(gdb) x 0x23d4000
0x23d4000:  Cannot access memory at address 0x23d4000
(gdb) x 0x2008000
0x2008000:  Cannot access memory at address 0x2008000
(gdb) x 0x2007000
0x2007000:  Cannot access memory at address 0x2007000
(gdb) x 0x2006000
0x2006000:  Cannot access memory at address 0x2006000
(gdb) x 0x2005000
0x2005000:  Cannot access memory at address 0x2005000
(gdb) x 0x2004000
0x2004000:  Cannot access memory at address 0x2004000
(gdb) x 0x2003000
0x2003000:  Cannot access memory at address 0x2003000
(gdb) x 0x2002000
0x2002000:  Cannot access memory at address 0x2002000
(gdb) x 0x2001000
0x2001000:  0x023de061
(gdb) x/500 0x2001000
0x2001000:  0x023de061  0x00000000  0x00000000  0x00000000
0x2001010:  0x023df061  0x00000000  0x00000000  0x00000000
0x2001020:  0x00000000  0x00000000  0x00000000  0x00000000
0x2001030:  0x00000000  0x00000000  0x00000000  0x00000000
0x2000000 also seemed to have reasonable data.
So, what we have right now: the code believes it has configured the page table entry in the "page table page directory" for index 8 (i.e. memory address 0x20008000) - the page table entry used for being able to modify page table 8 - in a correct way. The CPU has a different opinion. ![]()
I spotted a scenario in the code where we could return a RETURN_OUT_OF_MEMORY return value, in case we were out of physical pages. At this point, I added some checking for that (even though it seemed unlikely); unfortunately, it didn't help a tiny bit at all.
Is the memory being properly mapped?
Sometimes, when you step away from the machine, you have an interesting idea shortly after. This happened to me this time. After leaving the debug session because it was late at night (again...), I got this idea: why haven't I looked if the CR2 address is mapped? An excellent question; I think I got a bit confused because of the fact that it was the code that performs the virtual memory mappings that is failing. However, one of the first things to check when you run into an unhandled page fault should be to verify what the paging structures are set up correctly for the failing address.
Let's check what the page directory and page table indexes should be for the 0x02008009 address:
+--------------+--------------+----------------+
| 00 0000 1000 | 00 0000 1000 | 0000 0000 1001 |
+--------------+--------------+----------------+
  PD index       PT index       Address in page
00 0000 1000 = 8, i.e the entry in the process_page_directory that we were actually looking at a few minutes ago.
00 0000 1000 = 8 here as well.
I wonder; could this be caused by any recent changes in memory_virtual_map_real I did? (I admit: I did a bit of cleanup here also, but I think it was shortly after I ran into this last page fault.)
The fact that 0x23d4000 is unmapped within this process makes it obviously harder to look at the page table in question...
I googled a bit and read about the QEMU/Monitor, which can let me inspect physical memory as well. How nice! Let's dump out the contents of the first 16 dwords of that page and see what we get.
This is interesting; it does actually seem fishy.
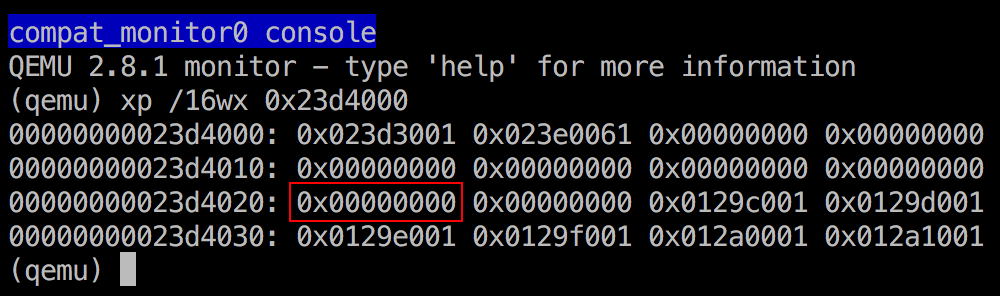
Do you see it? The ninth page table entry, i.e. page_table[8] is completely empty. That's not good. When debugging this in gdb now, we actually get another breakpoint for the same condition, but in that case it works. Let's inspect the physical memory in that case as well, just for the sake of it! I think we will find a non-zero entry there.
Breakpoint 1, memory_virtual_map_real (virtual_page=8194, physical_page=8971, pages=1, flags=0) at memory_virtual.c:380
380         page_table[page_table_index].present = 1;

(gdb) p/x process_page_directory[8]
$11 = {present = 0x1, flags = 0x3, accessed = 0x1, zero = 0x0, page_size = 0x0, global = 0x0, available = 0x0, page_table_base = 0x6}
Okay, so page_table_base is 0x6, that is 0x6000. This means that the page table for the address in question is located at that physical address. And QEMU says (same kind of command as above, just copied as text instead of as a screenshot this time):
(qemu) xp /16wx 0x6000
0000000000006000: 0x00005061 0x0230a061 0x00000000 0x00000000
0000000000006010: 0x00000000 0x00000000 0x00000000 0x00000000
0000000000006020: 0x00006061 0x00000000 0x0129c061 0x0129d001
0000000000006030: 0x0129e001 0x0129f001 0x012a0001 0x012a1001
(qemu)
The 0x00006061 value would be the ninth page table entry. I don't know the PTE (page table entry) format by heart, but I'm quite certain that this means it's referring to the physical page starting at 0x6000 (given that the low 12 bits of the PTE are for the present flag and other attributes, and the upper 20 bits are the page base address, shifted right 12 positions if you like.)
So to summarize this lengthy analysis: the address 0x02008000 in this case is referring to the page table itself, located at physical address 0x6000.
An idea: different contexts, with different paging structures is causing the difference
I think I know what the problem is now... If you know the Six stages of debugging, I'm kind of feeling like "How did that ever work?" right now.
The code that works has a call stack like this:
(gdb) bt
#0  memory_virtual_map_real (virtual_page=8194, physical_page=8971, pages=1, flags=0) at memory_virtual.c:380
#1  0x00105541 in memory_virtual_map_real (virtual_page=768, physical_page=4870, pages=4099, flags=0) at memory_virtual.c:354
#2  0x00105a0a in memory_virtual_map (virtual_page=768, physical_page=4870, pages=4099, flags=0) at memory_virtual.c:508
#3  0x0010748e in process_create (process_data=0x3f44) at process.c:297
#4  0x001026e0 in elf_execute (image=0x80000000 "\177ELF\001\001\001", parameter_string=0x4059 "/servers/initial_ramdisk.gz",
    process_id=0x102d00 <server_process_id>) at elf.c:177
#5  0x0010064a in kernel_main (arguments=1, argument=0x1171c4 <arguments_kernel+4>) at main.c:228
#6  0x00100120 in kernel_entry () at init.c:163
I.e., it gets called when creating the process during startup, before the dispatcher is enabled so that task switching can occur, but after virtual memory is enabled. The virtual memory structures in this case are set up for the kernel "process" or "context" if you like.
The failing code, on the other hand, is running from the boot server. Another process, another context. In that context, we don't have all physical memory mapped up. I think what is happening is roughly this:
We get into a case where we want to map up memory, but the page table entry in question is not present.
The code tries to set up this page table entry.
However, this page table entry exists in the very page we are trying to map up, i.e. the unmapped page would be needed to actually access the page table and create the page table entry... Hence, we get the illegal page fault.
I'm quite certain by now that this is indeed the problem. It's great to have an idea of what goes wrong, but more importantly - how can it be fixed? Also, why has this gone broken since it did indeed work at some point in time?
I decided to try and find an old backup of the code, to see how it looked there. The problem here is obviously that the code is old, ancient by any reasonable means. We're talking about code that's been laying around more or less unmaintained for the last 17 years. Even finding a reasonable backup is hard; we have changed source control providers multiple times during these years.
Doing that didn't help, unfortunately. I think it's safe to assume that we will not be able to dig up some piece of "gold" from an old version of the code, magically making everything work again. (Yes, I am actually hoping that sometimes...)
Thinking about different strategies for how to resolve the page fault
Let's instead think about how we can solve this. I can think of a few approaches:
-
Switch over to identity mapped paging. This is a much easier way to work with system structures (like page directory and page tables), since you always have access to the full RAM as needed by the kernel. I think this approach is quite popular among OS hobbyists, and we did use it in the (unfortunately unfinished) stormG3 kernel; it makes everything a lot simpler.
Downsides:
- Wasteful: will waste "maximum-supported-physical-memory" of the virtual memory address space. In stormG3 we decided to limit the physical memory to 2 GiB because of this. Realistically today, limiting physical memory to 2 GiB for chaos would be completely fine. It is a hobbyist system, after all.
- Risks: There's also a slight risk in making this change, since we might have to make a lot of rearrangements of existing mappings, basically all of them...
-
Time consuming: Potentially quite a lot of hard work, unless we cheat a bit and map
0x80000000->0x00000000instead (since it would cause a lot less conflicts with existing VM regions.) Doing so wouldn't be a "proper" identity map though, and we would loose a large part of the benefit that identity mapping would give us.
-
Allocate 1024 pages to keep the page tables in whenever a process starts, even though it probably will only use a fraction of it.
Downside: Very wasteful approach; running 10 processes will waste 40 MiB just for the page tables. (Not all of it is wasteful of course, but a lot of it is.)
Some other super-great approach that I will come up with until the next time I will be able to work on this again.

It was late at night again, but my mind kept thinking. Sometime, perhaps the day afterwards, I got it - the idea on how this can work, without any large rewrite or anything. I also talked to my good old friend Henrik Doverhill (née Hallin), who was one of the other previous core developers, about it.
A better strategy: reserving virtual memory space for process page tables
The "super-great" approach is this: use a fixed area of memory for the process-level page tables, and make sure that the page table for mapping these page tables (yes, I know this is a bit self-referential and mind-boggling...) is always allocated and mapped into the virtual address space whenever a process is created.
Something like this, assuming the virtual base address for the page tables is 0x10000000:
 +--------------------------------------------------+
 | Page directory entry for 0x10000000 - 0x12800000 |
 | (always present, allocated on `process_create`   |
 +--------------------------------------------------+
                          |
                          v
+----------------------------------------------------+
| Page table entries for the above region            |
| (with 'present' flag only set for allocated pages) |
+----------------------------------------------------+
                     |    |    |
                     v    v    v   (1024 entries)
      +-----------------------------------------+
      | Individual page tables for the process' |
      | virtual address space (4 GiB)           |
      +-----------------------------------------+
I must admit: when thinking about this, I thought to myself more than once "but this is not going to work". Virtual memory is hard and it's easy to get lost mentally , especially when dealing with "virtual memory mappings needed to be able to access virtual memory structures"... If you are reading this and developing an x86 operating kernel of your own: do the only sensible thing and go for identity mapping from the start. It's the only reasonable thing to do, and it's much easier to do it like that from the beginning than try to shove it in later on.
Now that we have made this great conclusion, let me come with another even greater one: this is exactly how it's already intended to work in the chaos kernel. ![]() If we look at the virtual memory overview once more, we see that the area between
If we look at the virtual memory overview once more, we see that the area between 0x02000000 and 0x02400000 is reserved for this exact purpose.
Digging deeper into the call trace
So, the fact that we get into this inner memory_virtual_map_real call in the first place is the problem here. Let's analyze the call stack for that a bit more to understand it better:
The stack trace looks like this:
(gdb) set output-radix 16
Output radix now set to decimal 16, hex 10, octal 20.
(gdb) bt full
#0  memory_virtual_map_real (virtual_page=0x2002, physical_page=0x24e5, pages=0x1, flags=0x0) at memory_virtual.c:380
        page_directory_index = 0x8
        page_table_index = 0x2
        page_table = 0x2008000
        counter = 0x0
#1  0x00105541 in memory_virtual_map_real (virtual_page=0x7d7, physical_page=0x24b1, pages=0x34, flags=0x3) at memory_virtual.c:354
        page_table_page = 0x24e5
        rv = 0x73
        page_directory_index = 0x2
        page_table_index = 0x3ff
        page_table = 0x2001000
        counter = 0x29
#2  0x00105a0a in memory_virtual_map (virtual_page=0x7d7, physical_page=0x24b1, pages=0x34, flags=0x3) at memory_virtual.c:508
        return_value = 0x2805b60
#3  0x00110f36 in memory_allocate (address=0xffffff7c, pages=0x34, cacheable=0x1) at memory.c:63
        physical_page = 0x24b1
        flags = 0x3
        page_number = 0x7d7
        __FUNCTION__ = "memory_allocate"
#4  0x00111540 in system_call_memory_allocate (address=0xffffff7c, pages=0x34, cacheable=0x1) at system_call.c:97
No locals.
The flow is roughly this:
- The
bootserver makes a system call tosystem_call_memory_allocate, requesting 52 (=0x34) pages. - The
memory_allocatemethod finds a contiguous block of physical pages large enough to satisfy this request. The physical address is0x24b1000, or around 36 MiB. It also locates a large-enough block in the virtual address space, at0x7d7000(between 7 and 8 MiB.) - It calls
memory_virtual_mapto map this physical block of pages into the virtual address space, which in turn callsmemory_virtual_map_realto do the real work. -
memory_virtual_map_realstarts looping over the 52 pages that it should map. When it reaches page 41 (0x29), the virtual address reaches a magic boundary -0x00800000, or exactly 8 MiB. Each entry in the page directory refers to a page table, which in turn maps 1024 pages, 4096 bytes each = 4 MiB. So when we reached 8 MiB we reached a "page table boundary". We went frompage_directory_index0x1 to 0x2, and this page table was not mapped. -
memory_virtual_map_realthen allocated a physical page (0x24e5) for this new page table, and inserted it into the page directory. It then called itself recursively, trying to map this physical page to virtual address0x02002000 - When doing so, it had to access the ninth page table, located at
0x02008000(because physical address0x00800000refers to page0x800, which is mapped in the ninth page table), but this virtual page was not mapped => the page fault occurs.
But why? Yesterday I thought I had it when I stated "...this page table entry exists in the very page we are trying to map up", but when looking at it now, that's not really the impression I get. It feels more like the method should call itself recursively one more time, or it is malfunctioning in some way.
The spontaneous feeling is that it seems weird that the inner call to memory_virtual_map_real has a page_directory_index of 8, since it's not dealing with memory in that region. The way the page_directory_index is calculated is this:
uint32_t page_directory_index = (virtual_page + counter) / 1024;
That should give me (0x2002 + 0x0) / 1024... hmm, okay. That's actually 8, since 0x2000 = 8192 in decimal.
I looked at the numbers again. The virtual base address 0x02000000 is at 32 MiB, so this makes some sense after all. (since each page directory entry addresses 4 MiB, and we previously concluded that we're looking at the ninth page directory entry - 0-7 takes care of 8 * 4 MiB, and the ninth PDE, index 8, takes care of 32-36 MiB - 1 byte.)
I concluded that it was perhaps time for the most powerful debugging tool once more - a pen, and a blank sheet of paper... ![]()
Wandering around in the desert
It's hard to get anywhere now. But, I think that what would be the right thing to do here is to add checking in the memory_virtual_map_real to try and prevent it from being run when the physical memory for the "process page tables" page is unmapped, because it means that this part of the code will never be able to work correctly. (We could conditionalize it so that the check is only performed if mappings for certain virtual addresses are being requested, but we could start by making it a big fat check at the entry of the function.)
It felt hard to formulate the condition, but I tried. Then I came to the problem that checking if the physical mapping existed would mean I perhaps would be reading from unmapped memory... Again, you should really be doing these kind of things with identity mapping instead, if possible.
My theory seemed correct; immediately when I had added this check, the machine would reboot on startup. ![]() (but I think that was because I mixed up virtual and physical addresses) I think I'll just make it simple for now and ensure that that specific page is always allocated and mapped on startup, and see if that helps get rid of the problem entirely. Something like this:
(but I think that was because I mixed up virtual and physical addresses) I think I'll just make it simple for now and ensure that that specific page is always allocated and mapped on startup, and see if that helps get rid of the problem entirely. Something like this:
    // The page tables page table is necessary for the kernel to be able to add page tables to this process at runtime.
    memory_physical_allocate(&physical_page, 1, "Page tables page table");
    memory_virtual_map(GET_PAGE_NUMBER(BASE_PROCESS_TEMPORARY), physical_page, 1, PAGE_KERNEL);
    memory_set_uint8_t((uint8_t *) BASE_PROCESS_TEMPORARY, 0, SIZE_PAGE);

    memory_virtual_map_other(process_tss,
                             GET_PAGE_NUMBER(BASE_PROCESS_PAGE_TABLES + (BASE_PROCESS_PAGE_TABLES / 1024)),
                             physical_page, 1, PAGE_KERNEL);
A new hope: another page fault
After compiling my new change and restarting qemu, I got this:
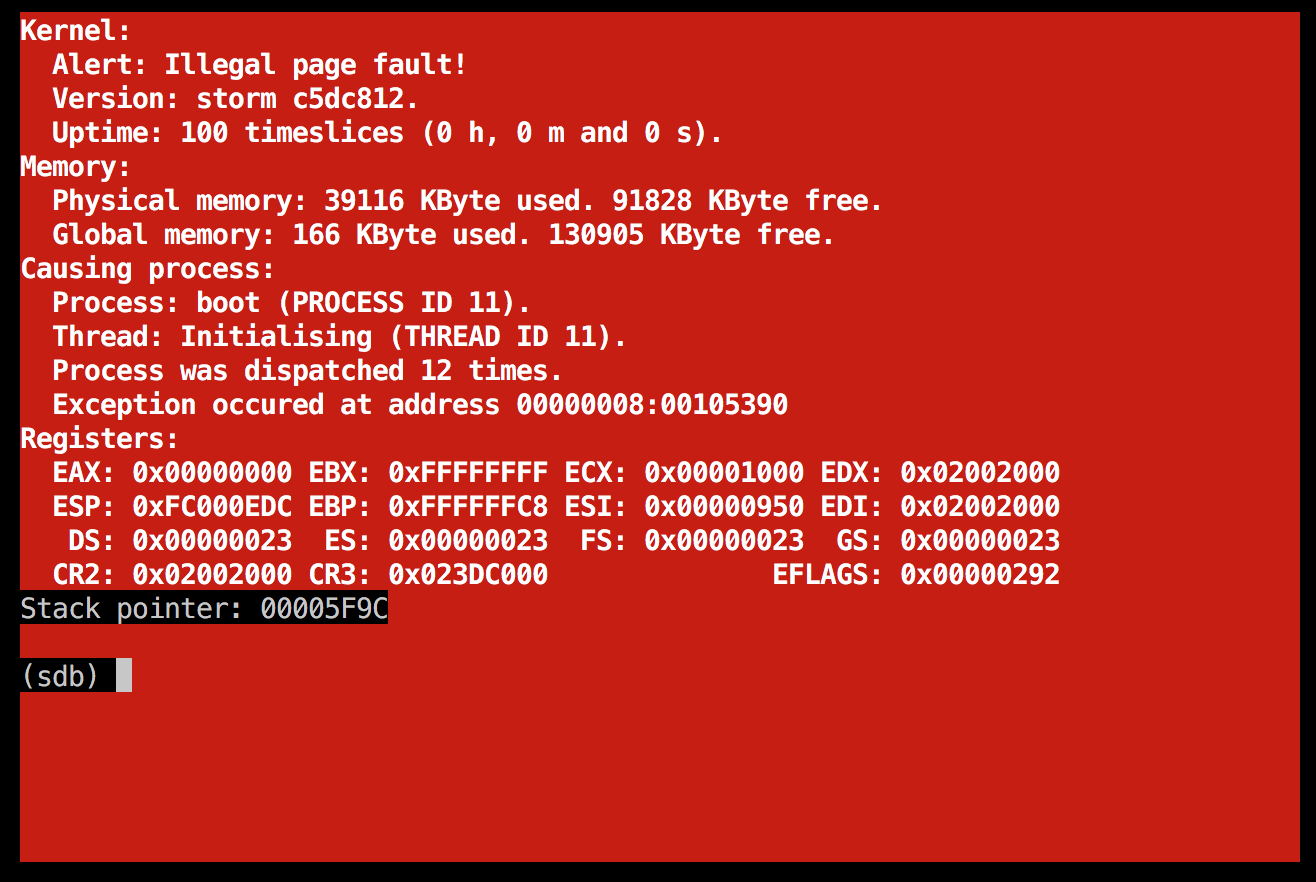
Despair not; despite this looking very similar to our previous page fault, it isn't actually. The previous one was referring to 0x02008000 something, but this time it's failing on 0x02002000.
Looking at the disassembly of the failing address gave me this:
(gdb) disassemble 0x105390
Dump of assembler code for function memory_set_uint8_t:
   0x00105376 <+0>: push   %edi
   0x00105377 <+1>: sub    $0x14,%esp
   0x0010537a <+4>: mov    0x20(%esp),%eax
   0x0010537e <+8>: mov    %al,(%esp)
   0x00105381 <+11>:    movzbl (%esp),%eax
   0x00105385 <+15>:    mov    0x1c(%esp),%edx
   0x00105389 <+19>:    mov    0x24(%esp),%ecx
   0x0010538d <+23>:    mov    %edx,%edi
   0x0010538f <+25>:    cld
   0x00105390 <+26>:    rep stos %al,%es:(%edi)
I think we again need to put a conditional breakpoint here to try and get a stack trace for this. Said and done - break memory_set_uint8_t if address == 0x02002000.
The stack trace looked like this:
(gdb) bt full
#0  memory_set_uint8_t (address=0x2002000 <error: Cannot access memory at address 0x2002000>, c=0x0, size=0x1000)
    at ../include/storm/current-arch/memory.h:92
        ecx = 0x0
        edi = 0x0
#1  0x00105574 in memory_virtual_map_real (virtual_page=0x7d7, physical_page=0x24bc, pages=0x34, flags=0x3) at memory_virtual.c:366
        page_table_page = 0x24f0
        rv = 0x0
        page_directory_index = 0x2
        page_table_index = 0x3ff
        page_table = 0x2001000
        counter = 0x29
#2  0x00105a0a in memory_virtual_map (virtual_page=0x7d7, physical_page=0x24bc, pages=0x34, flags=0x3) at memory_virtual.c:508
        return_value = 0x2805d18
#3  0x00110f92 in memory_allocate (address=0xffffff7c, pages=0x34, cacheable=0x1) at memory.c:63
        physical_page = 0x24bc
        flags = 0x3
        page_number = 0x7d7
        __FUNCTION__ = "memory_allocate"
#4  0x0011159c in system_call_memory_allocate (address=0xffffff7c, pages=0x34, cacheable=0x1) at system_call.c:97
No locals.
It seemed to have gotten a bit further, but the feeling was now that the case when the method called itself wasn't really working. I decided to put a breakpoint there to try and step into the method a bit, to understand the new problem better. This was unfortunately hard; something with the gdb/qemu combination seemed to cause some utterly weird kind of error, causing a new page fault at a completely different memory address if the breakpoint was enabled (!). Breakpoints changing the behavior of the code; such problems we abhor... Luckily, it typically "only" happens when you debug very system-oriented code like this.
Manually looking at page directory and page tables
So, the debugging seemed problematic. How about just looking at the page directory and page table entries again?
I cheated a bit a while ago, making a little script to help my tired brain with converting the virtual addresses to proper PD and PT entry indexes. So, I used that now here agin to help me look at the right data. Here are the contents of the page directory:
$ cat indexes.rb
#!/usr/bin/env ruby

address = ARGV.pop.to_i(16)

puts format "PD index: %u", (address / 4096) / 1024
puts format "PT index: %u", (address / 4096) % 1024

$ ./indexes.rb 0x2002000
PD index: 8
PT index: 2
(gdb) x/16x 0x00001000
0x1000: 0x023dd027  0x023eb027  0x024f1007  0x00000000
0x1010: 0x00000000  0x00000000  0x00000000  0x00000000
0x1020: 0x023de027  0x00000000  0x0129d123  0x0129e103
0x1030: 0x0129f103  0x012a0103  0x012a1103  0x012a2103
So index 8 == 0x1020, i.e. 0x023de027. That gives us a base address of the page table of 0x023de000.
(gdb) x/16x 0x023de000
0x23de000:  Cannot access memory at address 0x23de000
This felt strange at first, but this is a thinking error on my behalf - the 0x23de000 address is the physical address, so we must move to the qemu monitor now again:
(qemu) xp /16wx 0x23de000
00000000023de000: 0x023dd001 0x023eb061 0x00000000 0x00000000
00000000023de010: 0x00000000 0x00000000 0x00000000 0x00000000
00000000023de020: 0x023df061 0x00000000 0x0129d001 0x0129e001
00000000023de030: 0x0129f001 0x012a0001 0x012a1001 0x012a2001
Interesting. This makes sense; for whatever reason, the memory_virtual_map_real method has not been able to map this page as it should. I really wish I had a working debugger now...
Trying another approach: mapping the page directory as a page table
I learned an interesting trick on the OSDev Wiki (which is an invaluable resource when writing your own operating system btw):
Many prefer to map the last PDE to itself. The page directory will look like a page table to the system. To get the physical address of any virtual address in the range 0x00000000-0xFFFFF000 is then just a matter of...
I thought of this, and started realizing an interesting fact: I could use this instead of the "Page tables page table" approach above, to map the page tables into the virtual address space Think about it: if I would just map the page directory itself at the "page tables page table" location, the CPU would use that page directory entry, and then load the page directory again, this time as a page table which should let me access all the page tables very easily... without the need for any extra structures whatsoever.
The concept is explained further in this excellent Medium post; it has screenshots and more text to explain the concept. If you want even more, this rohitab.com tutorial; writes even more about it.
Both of these posts suggest you put the "page tables page table" at the virtual address 0xFFC00000. Because I already use that memory for something else, and have a designated area for this at 0x02000000 to 0x02400000, I will use my existing virtual address for this, to minimize the amount of changes that has to be done to the code.
I created the new method:
void memory_virtual_create_page_tables_mapping(page_directory_entry_page_table *other_process_page_directory, uint32_t page_directory_page)
{
    // The page tables page table is necessary for the kernel to be able to add page tables to this process at runtime. By abusing
    // the page directory as a page table, this clever hack should allow us to access all the page tables very easily.
    int page_tables_page_directory_index = BASE_PROCESS_PAGE_TABLES / SIZE_PAGE / 1024;
    other_process_page_directory[page_tables_page_directory_index].present = 1;
    other_process_page_directory[page_tables_page_directory_index].flags = PAGE_DIRECTORY_FLAGS;
    other_process_page_directory[page_tables_page_directory_index].accessed = 0;
    other_process_page_directory[page_tables_page_directory_index].zero = 0;
    other_process_page_directory[page_tables_page_directory_index].page_size = 0;
    other_process_page_directory[page_tables_page_directory_index].global = 0;
    other_process_page_directory[page_tables_page_directory_index].available = 0;
    other_process_page_directory[page_tables_page_directory_index].page_table_base = page_directory_page;
}
With this code in place, I got another completely strange page fault on startup... ![]()
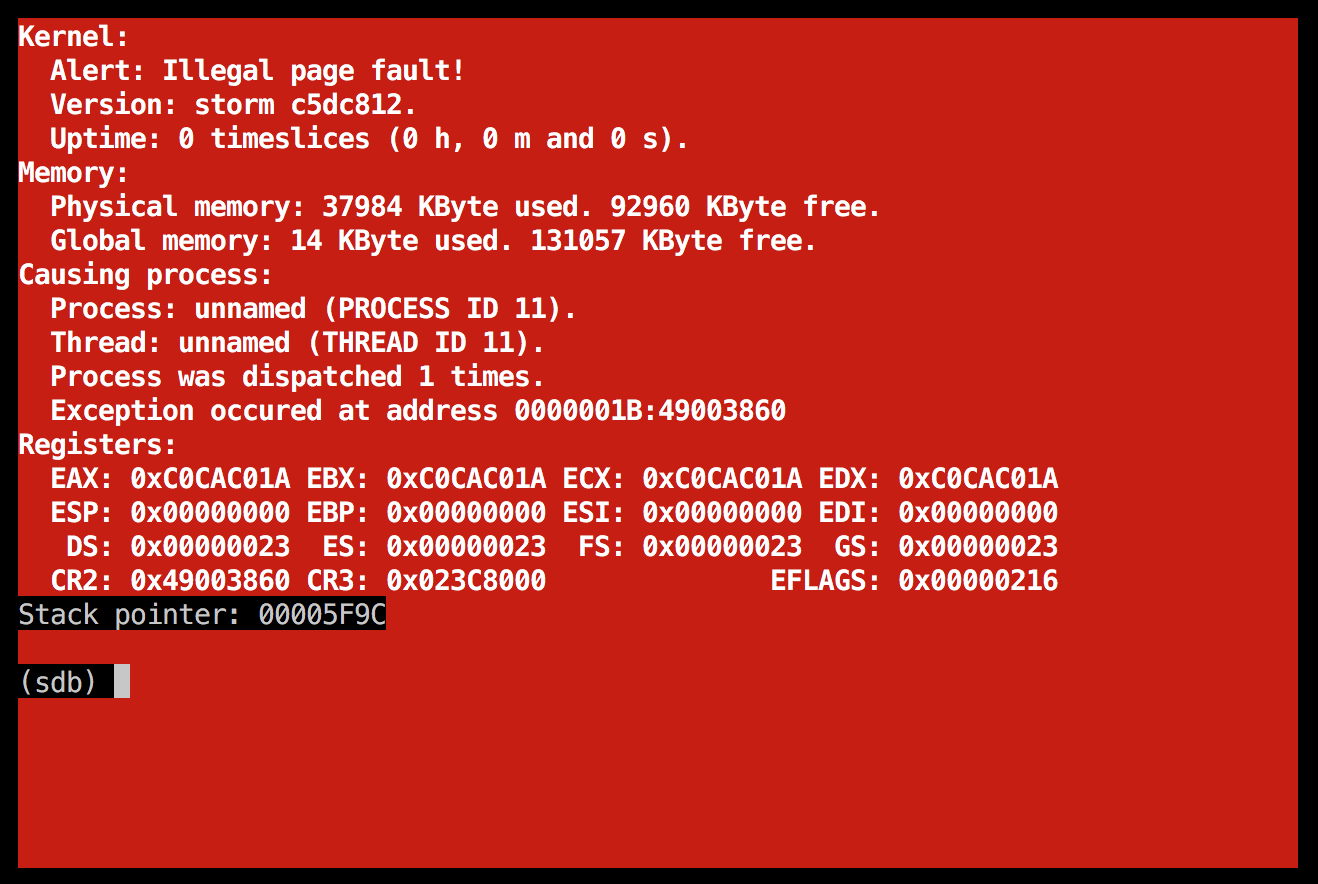
I'm quite certain that this was in the boot server now, since it used to have process ID 11 on previous occasions. But why did it start to fail like that all of a sudden? I hadn't changed anything that should cause that kind of problem...
This is unfortunately quite typical of hobbyist OS development; you make a change, and get a completely unexpected result - because there are some part of the overall picture that you're not taking into account, because you overwrite memory in a random way, or because of other reasons. You have to live with it and not get too stressed out or annoyed because of it; it's a matter of life.
I looked and concluded that 0x49003860 is the entrypoint for the boot server. A method unsurprisingly named startup. But why had that started to fail all of a sudden? I disabled the boot server for now, wanting to see if the other processes were starting up as they should.
Interestingly enough, no. When removing the boot server, I got the same error in process ID 10, i.e. the server right before the boot server in the list. So probably, all processes are broken now. I removed the new method call to memory_virtual_create_page_tables_mapping, which took me back to the previous error.
How about this: my new method has an error, causing the mapping of 0x49003860 to fail later on? I launched gdb and looked, but it seemed alright at first glance.
Maybe doing a bit of a lame test: moving the call to memory_virtual_create_page_tables_mapping later on in the process_create call (at the end of all mappings, before setting up the rest of the state for the new process.)
KERNEL BUG: Code is not properly mutexed
This is what it gave me now:
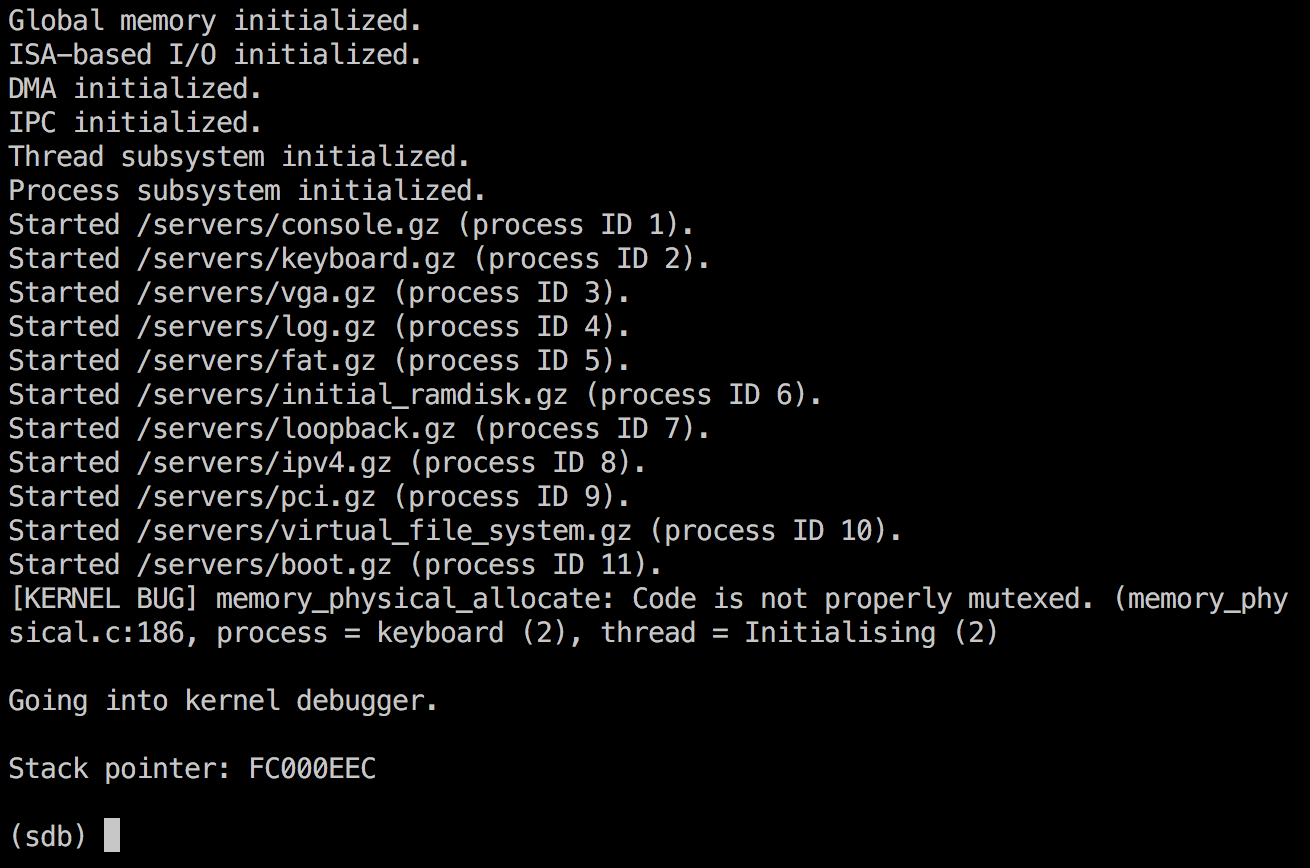
![]() ??? Why did we get that now, all of a sudden? (I didn't change any code in
??? Why did we get that now, all of a sudden? (I didn't change any code in memory_physical.c whatsoever.)
I decided to (once more) bring the code up in the debugger, placing a breakpoint at the failing line to perhaps get some more insight into this. I've actually seen this error before, so it's not unlikely that this is a pre-existing bug that I've rediscovered... It may have been covered before, by circumstances causing it not to trigger under normal usage or something.
Breaking on the failing line gave me this as the stack trace:
(gdb) bt full
#0  memory_physical_allocate (page=0xfc000f74, length=1, description=0x113d71 "Thread PL3 stack.") at memory_physical.c:186
        node = 0x2802168
        insert_node = 0xa000
        __FUNCTION__ = "memory_physical_allocate"
#1  0x00108bed in thread_create (start_routine=0x40002def, argument=0x0) at thread.c:331
        new_tss = 0xe89d418
        new_page_directory = 0x8000
        new_page_table = 0x9000
        stack_physical_page = 9207
        page_directory_physical_page = 9205
        page_table_physical_page = 9206
        index = 1024
        process_info = 0xe899138
        new_stack_in_current_address_space = 3149636
#2  0x001114d1 in system_call_thread_create (start_routine=0x40002def, argument=0x0) at system_call.c:42
No locals.
#3  0x0010bb2e in wrapper_thread_create () at wrapper.c:859
No locals.
That didn't give me that much, but when looking at the code I realized I could make it a bit more clear by telling the user which one was not locked (it checked for two different mutexes, and the error message didn't give any clue as to which one was unlocked.)
Something like this:
    if (initialised)
    {
        if (tss_tree_mutex != MUTEX_LOCKED)
        {
            DEBUG_HALT("tss_tree_mutex is expected to be locked when this method is called, but was unlocked.");
        }
        else if (memory_mutex != MUTEX_LOCKED)
        {
            DEBUG_HALT("memory_mutex is expected to be locked when this method is called, but was unlocked.");
        }
    }
Kernel bug: memory_mutex is expected to be locked when this method is called, but was unlocked
That gave me this:
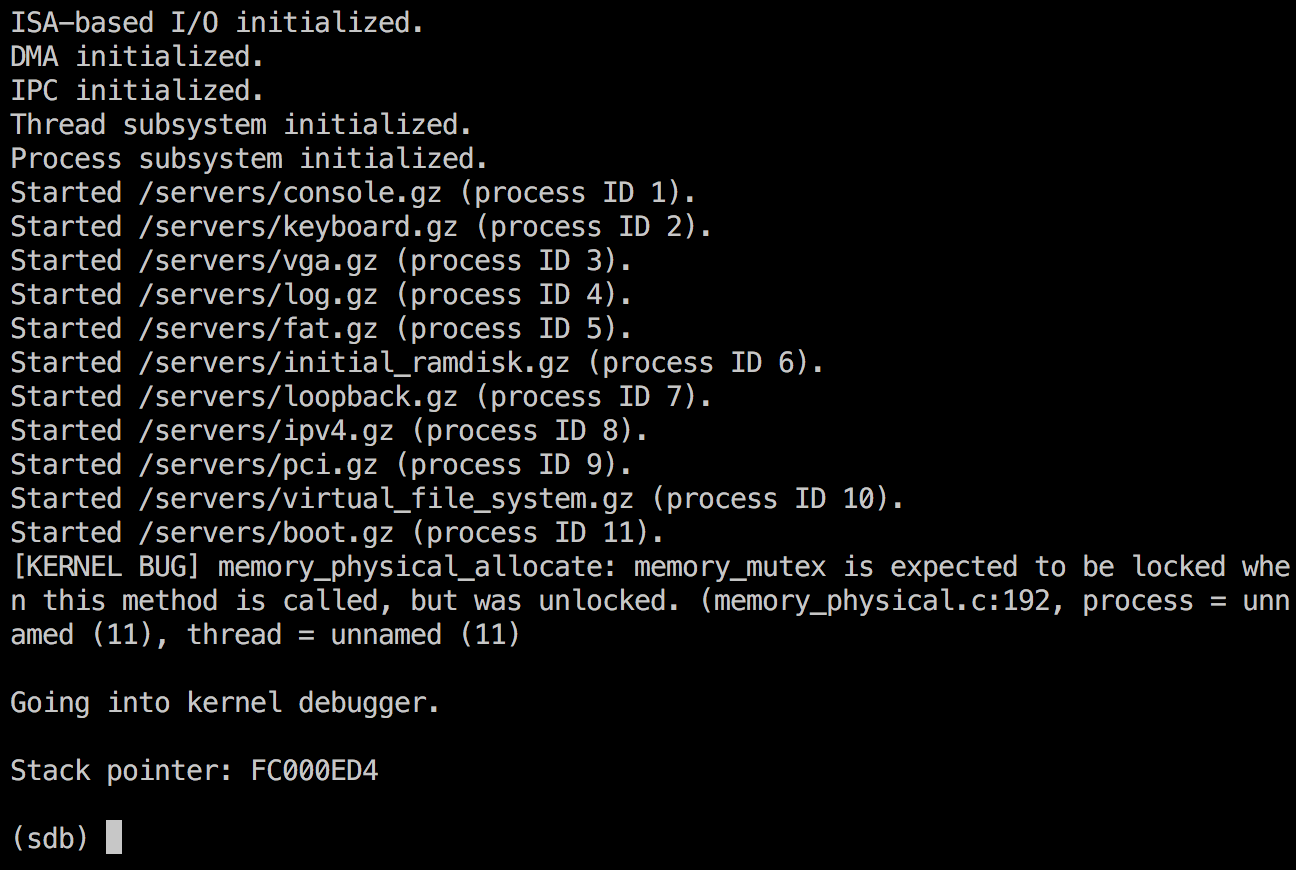
Incredibly interesting. This must be a side effect of the change I just did in process.c. Perhaps the code I added has the interesting side effect of changing the mutex state.
I disabled the call to memory_virtual_create_page_tables_mapping; it didn't make any change. Still got the same error. I then removed the memory_virtual_map call of the page directory page to BASE_PROCESS_TEMPORARY, which is used to be able to access the page directory from the calling context (which has a separate virtual address space.) Still the same, which is very strange. I had now disabled the new code, but it still behaved differently.
When looking at the diff, I got an idea:
diff --git a/storm/x86/process.c b/storm/x86/process.c
index bcfbd8e..18accf4 100644
--- a/storm/x86/process.c
+++ b/storm/x86/process.c
@@ -126,7 +124,6 @@ static process_id_type process_get_free_id(void)
 return_type process_create(process_create_type *process_data)
 {
     storm_tss_type *process_tss;
-    unsigned page_directory_page;
     unsigned counter;
     page_directory_entry_page_table *page_directory = (page_directory_entry_page_table *) BASE_PROCESS_TEMPORARY;
     uint32_t code_base, data_base = 0;
@@ -192,15 +189,13 @@ return_type process_create(process_create_type *process_data)

     // FIXME: Check return value.
     memory_physical_allocate(&physical_page, 1, "Page directory");
-
-    page_directory_page = physical_page;
+    unsigned page_directory_page = physical_page;
This was a seemingly harmless change I did; could that have caused this? Strange things happen sometimes; if it does affect this, it's clearly a bug "somewhere"... Let's try and reverting that part of the diff to see!
For better or worse, it did not change this in any way. I tried commenting out the memory_virtual_create_page_tables_mapping method altogether, thinking that the size of the code section could theoretically affect this in some way. Again, it didn't affect it at all. (I also did a full clean and rebuild of the whole system, just to ensure that no stale state was being preserved between builds or anything. The build tooling we have at the moment is unfortunately not foolproof in that regard.)
Stashing the changes and going back to a "known good" copy of the code
I then stashed my git working copy changes, and recompiled. Now it was back to an illegal page fault at address 0x02008008! Much better. At least now it's failing in an expected way, rather than a completely unexpected...
A little while later, I realized something: could it be this code that is triggering it?
diff --git a/storm/x86/memory_virtual.c b/storm/x86/memory_virtual.c
index 90c7550..a2e1c44 100644
--- a/storm/x86/memory_virtual.c
+++ b/storm/x86/memory_virtual.c
@@ -343,24 +346,28 @@ static return_type memory_virtual_map_real(uint32_t virtual_page, uint32_t physi

             process_page_directory[page_directory_index].page_table_base = page_table_page;

             // Make sure we could allocate memory.
             if (process_page_directory[page_directory_index].page_table_base == 0)
             {
                 return RETURN_OUT_OF_MEMORY;
             }

-            memory_virtual_map_real(
+            return_type rv = memory_virtual_map_real(
                 GET_PAGE_NUMBER(BASE_PROCESS_PAGE_TABLES) + page_directory_index,
                 (uint32_t) process_page_directory[page_directory_index].page_table_base,
                 1,
                 PAGE_KERNEL
             );

+            if (rv != RETURN_SUCCESS)
+            {
+                return rv;
+            }
+
             memory_set_uint8_t((uint8_t *)(BASE_PROCESS_PAGE_TABLES + (page_directory_index * SIZE_PAGE)), 0, SIZE_PAGE);
         }
The fact that we now return here if things go wrong could be somehow related to the problem. The method itself does not do any locking of this mutex, but it's worth checking this out anyway. I might as well add a DEBUG_HALT here, since the fact that the recursive call is failing is alarming and probably not a scenario where we just want to go on silently.
Commented out that part of the change for now; negative. It did not change a tiny bit.
I continued to clean up my working copy a bit, committing the "expected to be locked" cleanups, and stashing the rest. But now something strange happened! The problem was still here, even with the rest of the change stashed away!
Stepping back one more commit, finding the exact change that introduced the error
I did a git checkout HEAD~1, moving back one commit on the same branch. Compiled and run and now it worked again (that is, gave the expected illegal page fault...) Got back to the branch tip and now the error was back!!! Alright, reproducibility is always better than completely non-deterministic errors.
Incredibly odd indeed. I started comparing the diffs between readelf -S on the binary in the "working" and "failing" state:
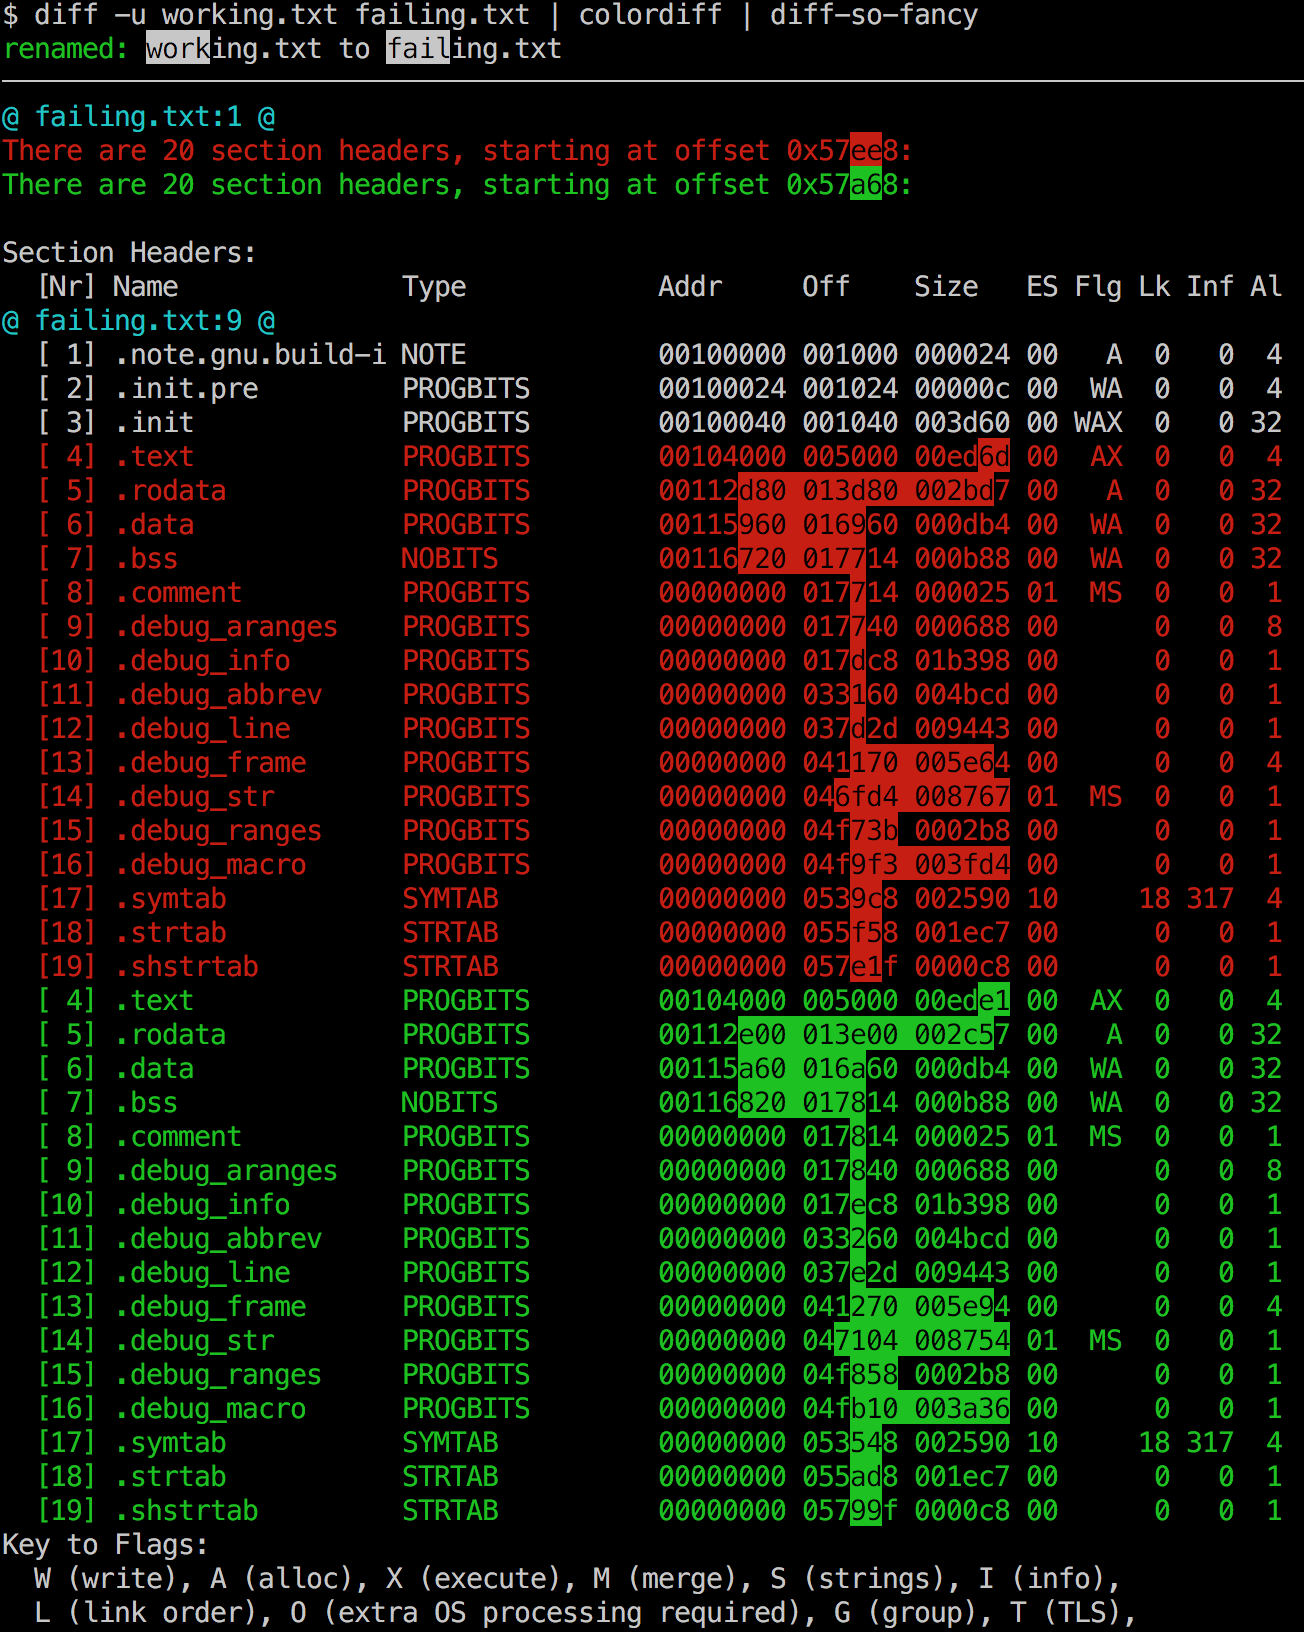
Nothing particular comes to mind when looking at that image, unfortunately. How utterly bizarre! Now is perhaps a good time to look at the failing code. I staretd with thread.c. The code is not pretty; we lock and unlock the mutexes quite a lot, perhaps as a way to avoid locking for longer than absolutely needed. But I think it makes the code more complex than needed; it's way too early to do these kind of micro-optimizations, IMHO.
Anyway, the code that calls memory_physical_allocate clearly has the mutex locked, that's what it looks like when reading the source code at least. So why is this not the case in reality?
I decided to put a breakpoint: break mutex_kernel_signal. I tried first with break mutex_kernel_signal if mutex == &memory_mutex etc., but they were never triggered, again for some odd reason.
An interesting detail: mutex_kernel_signal not being called as expected
I continued the stepping. But now we're seeing something interesting!
Breakpoint 4, mutex_kernel_signal (mutex=0x115a6c <process_id_mutex>) at mutex.c:121
121 {
(gdb)
Continuing.

Breakpoint 4, mutex_kernel_signal (mutex=0x115a80 <tss_tree_mutex>) at mutex.c:121
121 {
(gdb)
Continuing.
After a bunch of these, it crashed again; without the mutex_kernel_signal ever being called for the memory_mutex! Could we have some weird, unexpected form of memory corruption somehow? (Remember, this is C - anything can happen. ![]() )
)
I decided to enable some debugging code that I had laying around in the mutex.c file, which would print a lot of debugging information at runtime. This is what it looked like then:
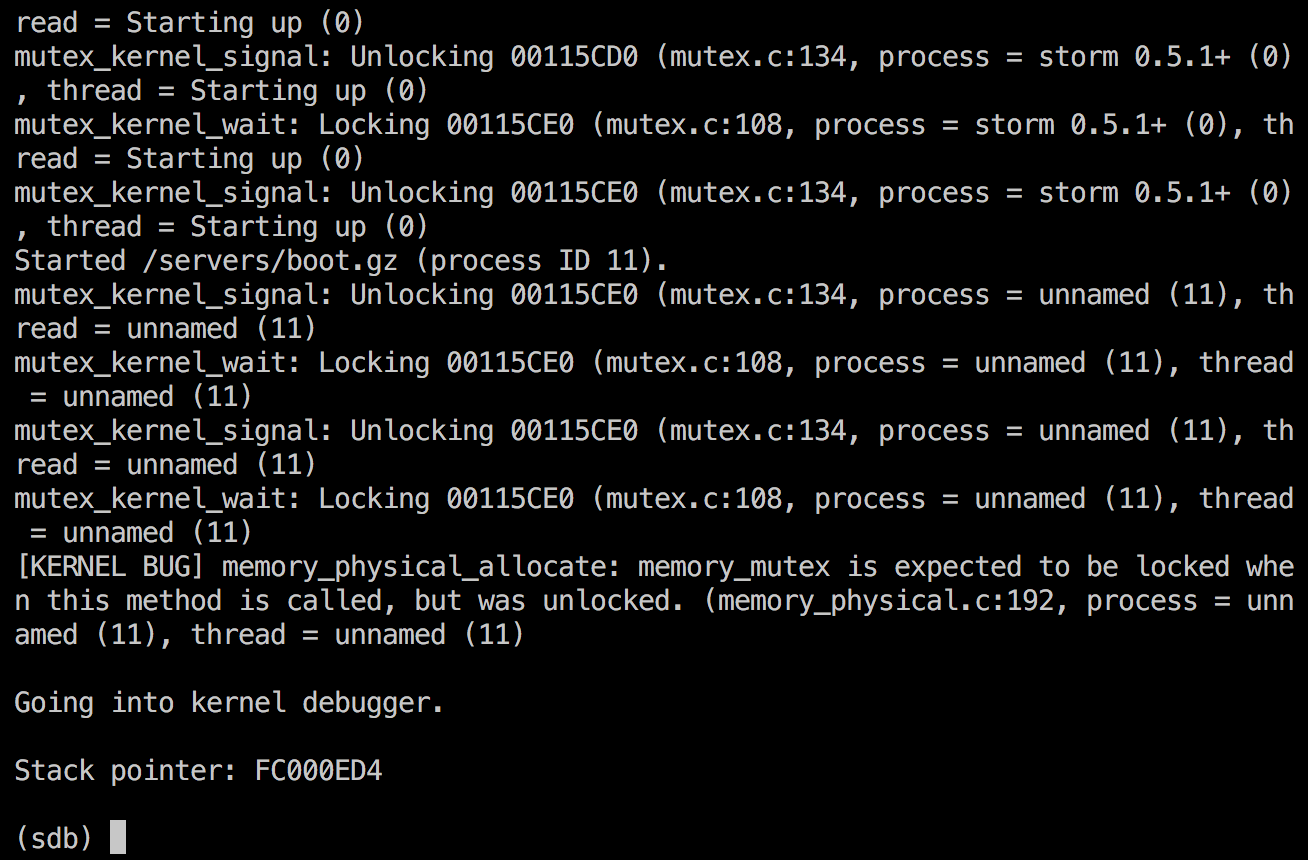
memory_mutex being locked even when it should not be
I was just about to give you the address of the memory_mutex, but when going into gdb to reveal it, I saw something very interesting!
(gdb) print memory_mutex
$1 = 1
(gdb) print &memory_mutex
$2 = (mutex_kernel_type *) 0x116a70 <memory_mutex>
That's incredibly interesting. I assumed now that 1 == MUTEX_LOCKED, so I looked at the code but was very surprised to see this:
enum
{
    MUTEX_LOCKED,
    MUTEX_UNLOCKED
};
That's an interesting way to write this... if I would write this code today, I would probably let 0 be == unlocked, to let the mutex be unlocked by default. Or, make it be MUTEX_INDETERMINATE by default or something if we want to force it to be set and not have any "valid" default value.
I wonder what will happen if I just reverse these values? I googled a bit and the OSDev wiki actually talks about semaphores having a default value of 1 when locked, and the explanation given there makes sense. However, our implementation is now more of a binary semaphore so it should not be "wrong" to have these values use the more "natural" values, from a C language perspective (where 0 == false, by definition.)
Anyway, I did the change and it did not change a thing. The memory_mutex was now 0 when the error state occurred. Good, since that indicates that this is not memory being corrupted in some weird or unexpected way; this is probably just a more "normal" software bug then.
Finding the mutexing bug: unintended change in the logic
It still failed. I attached the debugger and placed the breakpoint at the failing line again:
Breakpoint 1, memory_physical_allocate (page=0xfc000f48, length=1, description=0x11360f "Global memory data structure")
    at memory_physical.c:192
192             DEBUG_HALT("memory_mutex is expected to be locked when this method is called, but was unlocked.");
(gdb) print memory_mutex
$2 = 0
(gdb) print &memory_mutex
$3 = (mutex_kernel_type *) 0x1171c8 <memory_mutex>
(gdb) bt full
#0  memory_physical_allocate (page=0xfc000f48, length=1, description=0x11360f "Global memory data structure") at memory_physical.c:192
        node = 0x2802168
        insert_node = 0xe89f
        __FUNCTION__ = "memory_physical_allocate"
#1  0x00104876 in memory_global_allocate (length=5) at memory_global.c:369
        virtual_page = 59551
        physical_page = 1132972
        superblock = 0x0
        next = 0xe89e6cc
        index = 0
        block = 0x10b7b3 <mutex_kernel_wait+695>
        __FUNCTION__ = "memory_global_allocate"
#2  0x00107fc8 in process_name_set (name=0x4900402d "boot") at process.c:585
        process_info = 0xe899258
#3  0x001116a5 in system_call_process_name_set (name=0x4900402d "boot") at system_call.c:61
No locals.
#4  0x0010bc43 in wrapper_process_name_set () at wrapper.c:808
No locals.
I switched back to the version before the "debug printout" change I did, which worked (illegal page fault again.) Then I got an idea; did I mess up in the debug printout code?
commit 54ae0aa8c2732f5265f36b903d23dac40a832358 (HEAD -> fix/refactor-boot-server)
Author: Per Lundberg <perlun@gmail.com>
Date:   Mon Nov 6 21:31:58 2017 +0200

    memory_physical_allocate: Improved mutex sanity check logging.

    The previous message wasn't so clear; the user wouldn't know _which_ of the mutexes that had the unexpected value.

diff --git a/storm/x86/memory_physical.c b/storm/x86/memory_physical.c
index cdba24d..a076f61 100644
--- a/storm/x86/memory_physical.c
+++ b/storm/x86/memory_physical.c
@@ -181,9 +181,16 @@ return_type memory_physical_allocate(uint32_t *page, unsigned int length, const
     avl_node_type *node = page_avl_header->root;
     avl_node_type *insert_node;

-    if (tss_tree_mutex != MUTEX_LOCKED && memory_mutex != MUTEX_LOCKED && initialised)
+    if (initialised)
     {
-        DEBUG_HALT("Code is not properly mutexed.");
+        if (tss_tree_mutex != MUTEX_LOCKED)
+        {
+            DEBUG_HALT("tss_tree_mutex is expected to be locked when this method is called, but was unlocked.");
+        }
+        else if (memory_mutex != MUTEX_LOCKED)
+        {
+            DEBUG_HALT("memory_mutex is expected to be locked when this method is called, but was unlocked.");
+        }
     }

     //debug_print ("Called for: %s\n", description);
My poor soul! Do you see it? I changed the logic here; it's not really strange that it broke. The code looked for either the tss_tree_mutex or the memory_mutex being unlocked, but I just messed up, completely, in my attempt to make the world a better place... ![]()
Anyway, after crying about my incompetence for a while ![]() I fixed the actual bug, and was now back at the "illegal page fault" again. I unstashed my changes and got back to this:
I fixed the actual bug, and was now back at the "illegal page fault" again. I unstashed my changes and got back to this:
[KERNEL BUG] memory_physical_allocate: tss_tree_mutex or memory_mutex is expected to be locked when this method
is called, but both of these mutexes were unlocked. (memory_physical.c:188, process = keyboard (2), thread =
Initialising (2)

Going into kernel debugger.

Stack pointer: FC000EEC

(sdb)
Back to breaking at mutex_kernel_signal
We lost quite a bit of time there, but that's life sometimes. Let's see now if we can find the real bug, the one that got me sidetracked, fixing things in the wrong way etc...
I decided to continue the gdb track a bit more. Maybe it would give us some clues as to why this is happening.
(gdb) break mutex_kernel_signal
Breakpoint 1 at 0x10b715: file mutex.c, line 118.
(gdb) cont
Continuing.

Breakpoint 1, mutex_kernel_signal (mutex=0x116898 <process_id_mutex>) at mutex.c:118
118 {
(gdb) cont
Continuing.

Breakpoint 1, mutex_kernel_signal (mutex=0x1168c0 <tss_tree_mutex>) at mutex.c:118
118 {
(gdb)
Continuing.

Breakpoint 1, mutex_kernel_signal (mutex=0x11688c <process_tree_mutex>) at mutex.c:118
118 {
(gdb)

(...about 50 more occurrences omitted)

Breakpoint 1, mutex_kernel_signal (mutex=0x116fe8 <memory_mutex>) at mutex.c:118
118 {
(gdb)
Continuing.

Breakpoint 1, mutex_kernel_signal (mutex=0x1168c0 <tss_tree_mutex>) at mutex.c:118
118 {
(gdb)
Continuing.

Breakpoint 1, mutex_kernel_signal (mutex=0x1168c0 <tss_tree_mutex>) at mutex.c:118
118 {
(gdb)
Continuing.

Breakpoint 1, mutex_kernel_signal (mutex=0x1168c0 <tss_tree_mutex>) at mutex.c:118
118 {
(gdb)
Continuing.
And BAM! Then it crashed. But hey? Another way of crashing now? ![]()
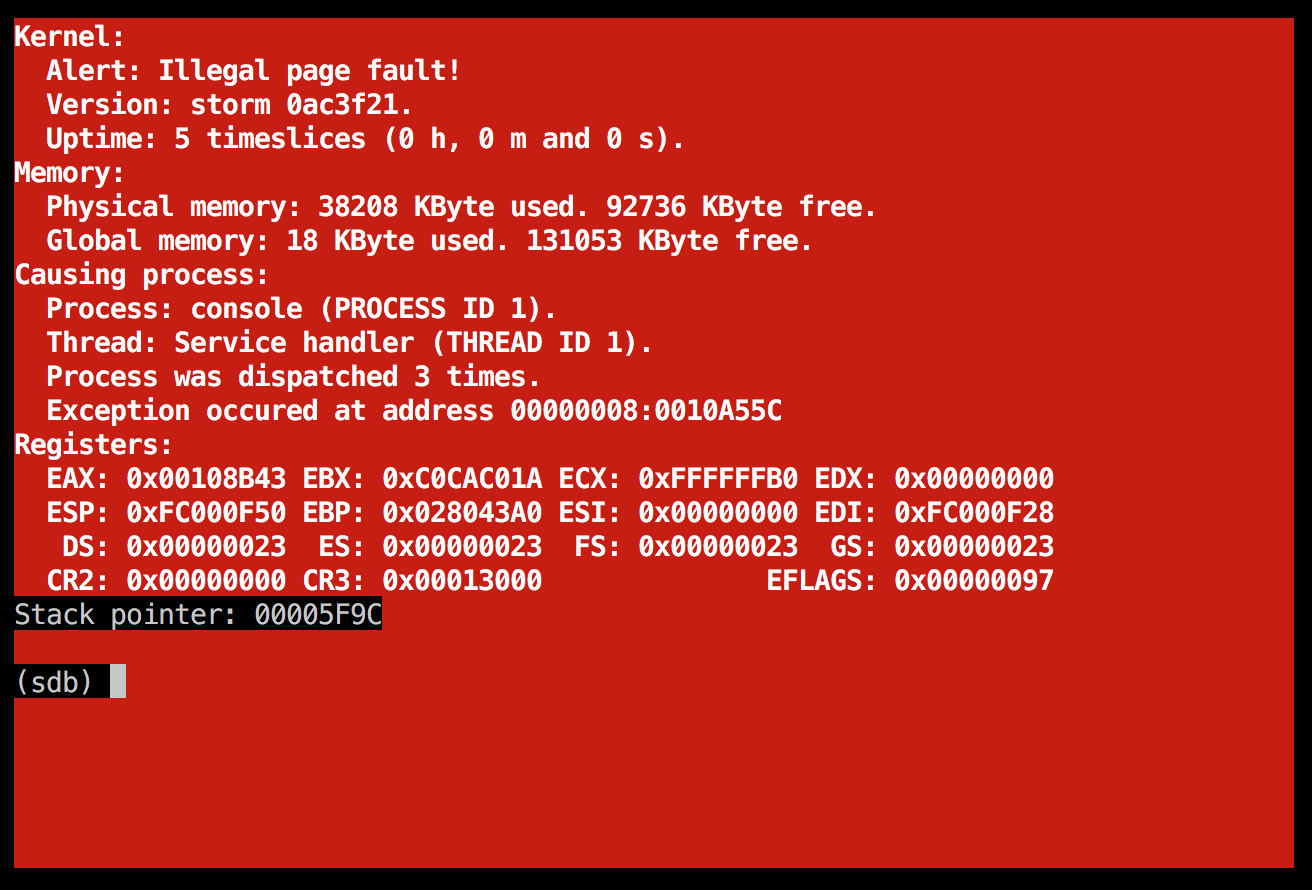
CR2 == 0x00000000, i.e. a null pointer. The failing code is this:
249     asm volatile
   0x0010a545 <+22>:    call   0x10a4db <dispatch_update>
   0x0010a54a <+27>:    mov    %al,%bl
   0x0010a54c <+29>:    mov    $0x20,%al
   0x0010a54e <+31>:    out    %al,$0x20
   0x0010a550 <+33>:    cmp    $0x1,%bl
   0x0010a553 <+36>:    je     0x10a55b <dispatch_task_switcher+44>
   0x0010a555 <+38>:    ljmp   *0x116920
   0x0010a55b <+44>:    popa
   0x0010a55c <+45>:    iret
gdb potentially messing up the state of the program, again
iret = return from an interrupt handler. Utterly weird indeed, that this code would fail. I looked at the dispatch_update method and it seemed to get into this code path if a task switch could not happen (because the mutexes are locked), but... I'm quite certain this has worked previously. It's not completely unlikely that the gdb session is somehow messing up the state so that the code doesn't run exactly like normal.
This is obviously bad, because it means we cannot reliably know that the mutex_kernel_signal for the tss_tree_mutex is really the last time the mutex is signalled before the crash; we don't know if this gdb-incited crash happened at the same time as the "real" non-gdb crash we're debugging.
(I should really get into functional programming instead. Like Haskell. No side effects, only pure functions. Purely deterministic program runs, no strange surprises. Sounds almost too good to be true.
)
Let's look at the code in question again. Excerpt from thread_create:
    mutex_kernel_wait(&memory_mutex);

    // Start by creating a PL0 stack. Remember that the lowest page of the stack area is the PL0 stack.
    memory_physical_allocate(&stack_physical_page, 1, "Thread PL0 stack.");
    memory_virtual_map(GET_PAGE_NUMBER(BASE_PROCESS_CREATE), stack_physical_page, 1, PAGE_KERNEL);
    memory_copy((uint8_t *) BASE_PROCESS_CREATE, (uint8_t *) BASE_PROCESS_STACK, SIZE_PAGE * 1);
    memory_virtual_map_other(new_tss, GET_PAGE_NUMBER(BASE_PROCESS_STACK), stack_physical_page, 1, PAGE_KERNEL);

    new_tss->esp = cpu_get_esp();

    // This stuff needs to run while the PL0 stack is being mapped, since ESP will (because of technical reasons ;)
    // currently point into the PL0 stack. This happens because we are currently running kernel code, so it's not really that
    // weird after all.
    uint32_t new_stack_in_current_address_space = BASE_PROCESS_CREATE + (new_tss->esp - BASE_PROCESS_STACK);
    new_tss->esp -= 4;
    new_stack_in_current_address_space -= 4;
    *(void **)new_stack_in_current_address_space = argument;

    new_tss->esp -= 4;
    new_stack_in_current_address_space -= 4;
    *(void **)new_stack_in_current_address_space = NULL;

    // Phew... Finished setting up a PL0 stack. Lets take a deep breath and do the same for the PL3 stack, which is
    // slightly more complicated.

    memory_physical_allocate(&stack_physical_page, current_tss->stack_pages, "Thread PL3 stack.");
That last line ("Thread PL3 stack") is failing. But why? We see that the memory_mutex is clearly locked at the beginning of the quoted code.
Maybe I'll put a breakpoint right there and then, when that breakpoint is triggered, add a breakpoint at mutex_kernel_signal. That can perhaps help me nail this down.
I tried this approach. But again, I got really strange behavior in gdb:
Breakpoint 3, thread_create (start_routine=0x4000132c, argument=0x0) at thread.c:300
300     mutex_kernel_wait(&memory_mutex);
(gdb) next
304     memory_physical_allocate(&stack_physical_page, 1, "Thread PL0 stack.");
(gdb) print memory_mutex
$2 = 1
(gdb) break mutex_kernel_signal
Breakpoint 4 at 0x10b715: file mutex.c, line 118.
(gdb) cont
Continuing.

Breakpoint 4, mutex_kernel_signal (mutex=0x300000) at mutex.c:118
118 {
(gdb) bt full
#0  mutex_kernel_signal (mutex=0x300000) at mutex.c:118
No locals.
#1  0x00108b43 in thread_create (start_routine=0x4000132c, argument=0x0) at thread.c:306
        new_tss = 0xe89e818
        new_page_directory = 0x8000
        new_page_table = 0x9000
        stack_physical_page = 9192
        page_directory_physical_page = 9190
        page_table_physical_page = 9191
        index = 1024
        process_info = 0x1168c0 <tss_tree_mutex>
        new_stack_in_current_address_space = 1073758391
#2  0x001114c6 in system_call_thread_create (start_routine=0x4000132c, argument=0x0) at system_call.c:42
No locals.
#3  0x0010bb22 in wrapper_thread_create () at wrapper.c:859
No locals.
#4  0x4000132c in ?? ()
No symbol table info available.
#5  0x400036a3 in ?? ()
No symbol table info available.
thread.c line 306 doesn't even call mutex_kernel_signal! And 0x300000, that's not exactly a valid mutex:
(gdb) print mutex
$3 = (mutex_kernel_type *) 0x300000
(gdb) print *mutex
$4 = 1651076143
I think this is gdb having problems to resolve the code line, because both memory_copy (the function called) and mutex_kernel_signal are inlined, or something similar. I continued the running, but I was again seeing difference in behavior ("illegal page fault" instead of the "tss_tree_mutex or memory_mutex is expected to be locked" error, grr.) which was very annoying.
"Help me printf, you're my only hope"
Hmm, maybe I have to just enable the debug printing again... printf-style debugging is lame, but sometimes it's the only thing that works.
Interesting - this again changed the scene a little bit:
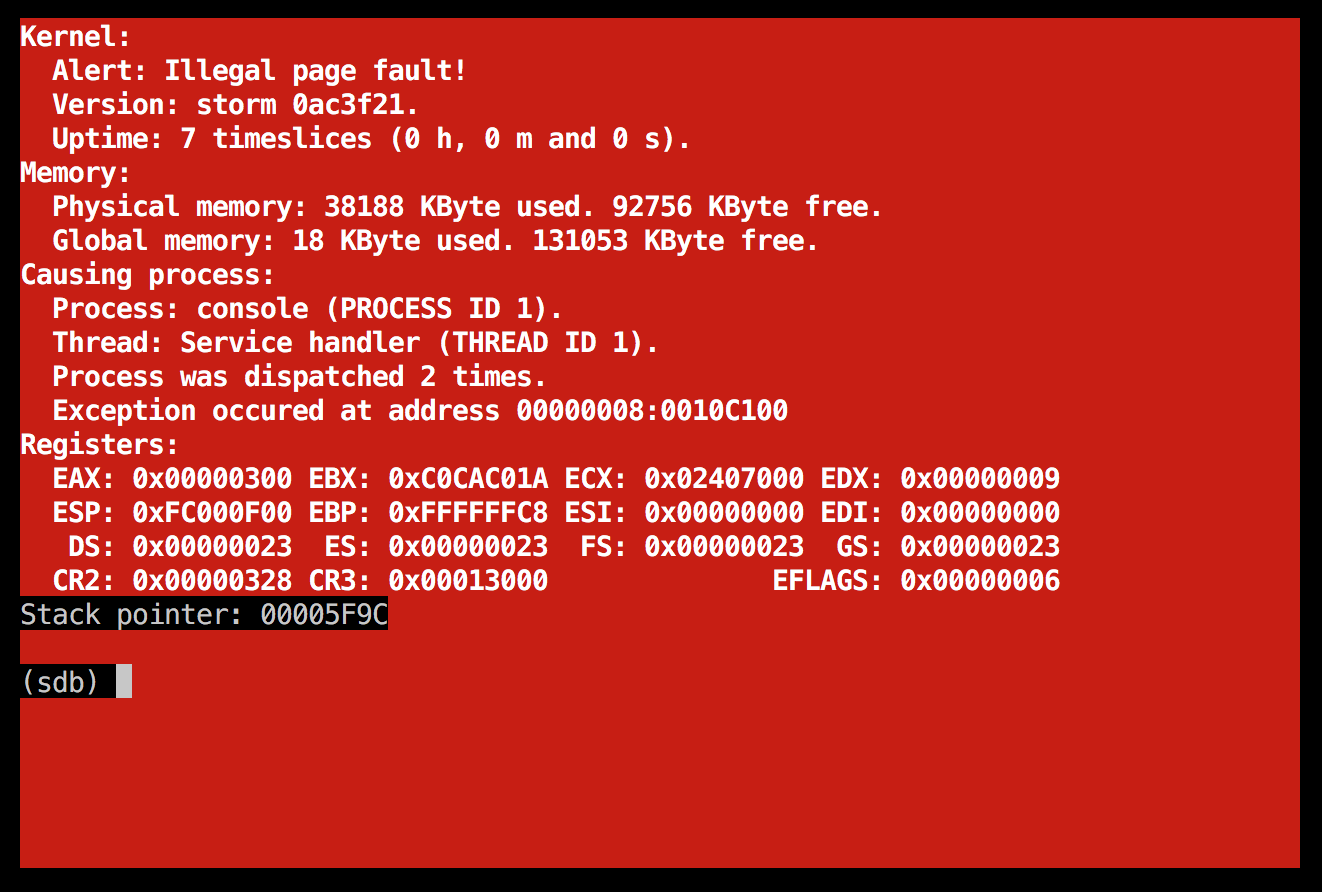
This is the failing code now (the last instruction in the disassembly below):
Dump of assembler code for function avl_node_allocate:
avl.c:
42  {
   0x0010c0dc <+0>: push   %ebx
   0x0010c0dd <+1>: sub    $0x18,%esp

43      unsigned index, temp, bit_index = 0;
   0x0010c0e0 <+4>: movl   $0x0,0x4(%esp)

44
45      // Find a free entry from the bitmap.
46      for (index = 0; index < avl_header->limit_nodes / 32; index++)
   0x0010c0e8 <+12>:    movl   $0x0,0xc(%esp)
   0x0010c0f0 <+20>:    jmp    0x10c1b6 <avl_node_allocate+218>

47      {
48          if (avl_header->bitmap[index] != UINT32_MAX)
   0x0010c0f5 <+25>:    mov    0x20(%esp),%eax
   0x0010c0f9 <+29>:    mov    0xc(%esp),%edx
   0x0010c0fd <+33>:    add    $0x8,%edx
   0x0010c100 <+36>:    mov    0x4(%eax,%edx,4),%eax
I wonder: could it be that the memory_virtual_map_real function messes up the mappings that are set up in the recently created memory_virtual_create_page_tables_mapping function? (around the heading "Kernel bug: memory_mutex is expected to be locked when this method is called, but was unlocked", which distracted me for a while.)
I thought at this point it would make sense to actually look at the newly created page directory entry to see that it looked reasonable, and perhaps also look at its "page table" (= the page directory). Maybe it will give me a hint about the underlying problem here...
I placed a breakpoint in the failing code again (memory_physical.c:188) and inspected the page directory:
(gdb) x/16x process_page_directory
0x1000: 0x0011c067  0x0012b067  0x00000000  0x00000000
0x1010: 0x00000000  0x00000000  0x00000000  0x00000000
0x1020: 0x0011b027  0x00000000  0x0129d123  0x0129e103
0x1030: 0x0129f103  0x012a0103  0x012a1103  0x012a2103
The entry 0x0011b027 is "our" entry in this case. Let's look at that physical page in the QEMU monitor now. If all is correct, the first words at 0x0011b000 should be the exact same as shown above.
compat_monitor0 console
QEMU 2.8.1 monitor - type 'help' for more information
(qemu) xp /16wx 0x0011b000
000000000011b000: 0x0011c067 0x0012b067 0x00000000 0x00000000
000000000011b010: 0x00000000 0x00000000 0x00000000 0x00000000
000000000011b020: 0x0011b027 0x00000000 0x0129d123 0x0129e103
000000000011b030: 0x0129f103 0x012a0103 0x012a1103 0x012a2103
"Unfortunately", it looks really good!
So what if we look at page table 0 then, in gdb?
(gdb) x/16x BASE_PROCESS_PAGE_TABLES
0x2000000:  0x00000000  0x0011b021  0x00007101  0x00000000
0x2000010:  0x00000000  0x00000000  0x00000000  0x00000000
0x2000020:  0x023f5021  0x023f8061  0x00001121  0x0000b161
0x2000030:  0x00000000  0x00000000  0x00000000  0x00000000
Hard to say anything obvious about that one. Some page table entries have values, others are empty. I cannot really say from this whether it's "wrong" or "right", yet.
And how about the next "page table" then, what does it look like?
(gdb) x/16x BASE_PROCESS_PAGE_TABLES + 4096
0x2001000:  0x00129061  0x00000000  0x00000000  0x00000000
0x2001010:  0x0012a061  0x00000000  0x00000000  0x00000000
0x2001020:  0x00000000  0x00000000  0x00000000  0x00000000
0x2001030:  0x00000000  0x00000000  0x00000000  0x00000000
Also looks reasonable, from a quick glance.
Continuing the tricky debugging quest in gdb
Going back to gdb again, tried to place breakpoints etc. but it seemed very fragile and unfortunately timing dependent; it was hard to narrow down the problem that way. I thought to myself: If/when I managed to solve this, I would be a worthy winner of a Nobel Price or something. ![]() That's how hard it felt at this time.
That's how hard it felt at this time.
I looked at the code again. The thread_create method had a nasty section that looked like this:
    // FIXME: We shouldn't have to do like this.
    DEBUG_MESSAGE(DEBUG, "Disabling interrupts");
    cpu_interrupts_disable();
You're right about that, you program. This is evil, we shouldn't have to do like that. Let's disable that since the water is let loose anyway; nothing is working at the moment so we might as well make it a bit worse until we fix it for good...
I also cleaned up the dispatcher code a bit, adding some code there to just return and do nothing if the tss_tree_mutex is locked. That's a pretty important piece of code now, since we really really really don't want a half-finished thread currently being created in thread_create getting spawned by the dispatcher before it's completely ready:
// Release the rest of this time slice so that we can go on task switching.
void dispatch_next(void)
{
    cpu_interrupts_disable();

    if (tss_tree_mutex == MUTEX_LOCKED)
    {
        // Mutex is locked => we cannot dispatch any new task. Just return to the caller and let it finish it's exclusive sections.
        cpu_interrupts_enable();
        return;
    }

    // Make sure we don't get aborted. mutex_kernel_wait can not be used from this context.
    tss_tree_mutex = MUTEX_LOCKED;
Interestingly enough, after making these changes I would get the exact same [KERNEL BUG] scren as before. That is, this:
[KERNEL BUG] memory_physical_allocate: tss_tree_mutex or memory_mutex is expected to be locked when this method
is called, but both of these mutexes were unlocked. (memory_physical.c:188, process = keyboard (2), thread =
Initialising (2)

Going into kernel debugger.

Stack pointer: FC000EEC
I now decided to clean out the mess that was thread_create a bit. That is, I wanted to replace these calls:
    mutex_kernel_wait(&memory_mutex);
    // ...do stuff...
    mutex_kernel_signal(&memory_mutex);

    mutex_kernel_wait(&tss_tree_mutex);
    // ...do stuff...
    mutex_kernel_signal(&tss_tree_mutex);

    mutex_kernel_wait(&memory_mutex);
    // ...do stuff...
    mutex_kernel_signal(&memory_mutex);

    mutex_kernel_wait(&tss_tree_mutex);
    // ...do stuff...
    mutex_kernel_signal(&tss_tree_mutex);
...with only one set of mutex locking and unlocking. Seriously! That code above is insane. Yeah, sure, if we're talking about a really timing critical issue of the kernel, where we have profiled the code and concluded that the mutex locking is a performance problem - go ahead, by all means try to use fine grained mutex locking like this.
For the rest of us, one single locking and one single unlocking of the mutexes will make it about a gazillion times simpler to reason about the code. So I will now replace the above with this KISS approach:
    mutex_kernel_wait(&memory_mutex);
    mutex_kernel_wait(&tss_tree_mutex);
    // ...do stuff...
    mutex_kernel_signal(&tss_tree_mutex);
    mutex_kernel_signal(&memory_mutex);
We could perhaps get away with just using the single tss_tree_mutex lock, but I'm perfectly fine with using these two as well.
Illegal page fault in the log server
I then ran the code and got this as the result:
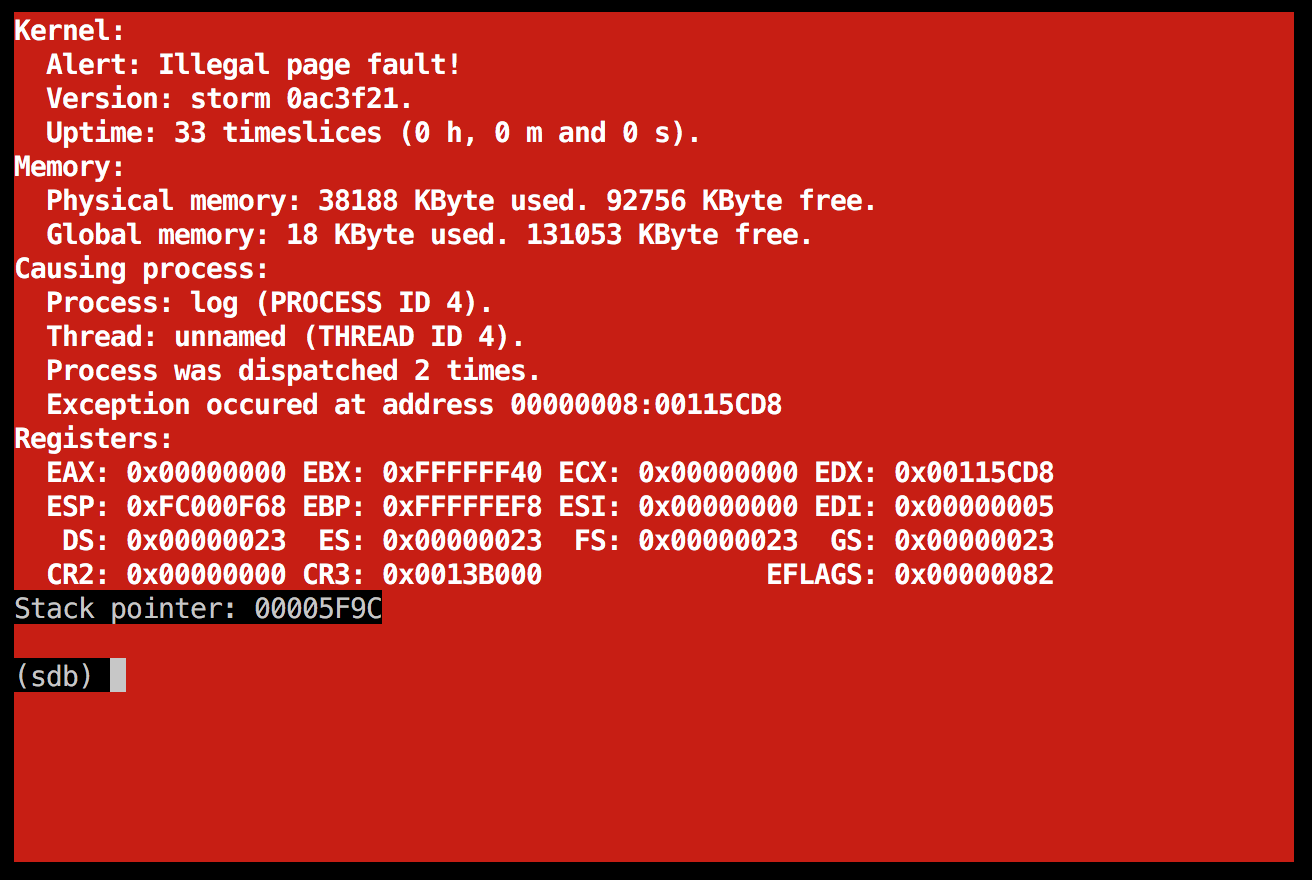
I definitely like NULL pointer errors more than some weird, bizarre values in CR2, that's for sure. Disassembling the 0x00115CD8 address showed me that the failing code was in mutex_spinlock:
(gdb) disassemble/s 0x00115CD8
Dump of assembler code for function mutex_spinlock:
   0x00115cd8 <+0>: add    %eax,(%eax)
   0x00115cda <+2>: add    %al,(%eax)
Could it be that our mutexing code didn't work properly after all? The disassembly wasn't so pleasing this time (probably because the method was being inlined) so I looked with objdump -S also.
Interesting. objdump didn't give me anything, but I saw an interesting fact: that address (0x115CD8) is actually outside our addressable code section. Here is an excerpt from readelf:
There are 20 section headers, starting at offset 0x577a8:

Section Headers:
  [Nr] Name              Type            Addr     Off    Size   ES Flg Lk Inf Al
  [ 0]                   NULL            00000000 000000 000000 00      0   0  0
  [ 1] .note.gnu.build-i NOTE            00100000 001000 000024 00   A  0   0  4
  [ 2] .init.pre         PROGBITS        00100024 001024 00000c 00  WA  0   0  4
  [ 3] .init             PROGBITS        00100040 001040 003d60 00 WAX  0   0 32
  [ 4] .text             PROGBITS        00104000 005000 00ed02 00  AX  0   0  4
  [ 5] .rodata           PROGBITS        00112d20 013d20 002b97 00   A  0   0 32
  [ 6] .data             PROGBITS        001158c0 0168c0 000d90 00  WA  0   0 32
Do you see it? The address 0x115CD8 seems more like data than actual code. How about dumping the bytes at this address:
0x115cd0 <limit_mailbox_hash_entries>: 0x00000400 0x00000400 0x00000001 0x00000000
Okay, I'm not getting anywhere here, let's try a different track for a while. How about making things extremely simple? Let's just start a single server and see if that works. Perhaps the console server is our friend tonight...
Worked, no immediate errors at least. That's a good start. How about re-adding servers one after another and see which one triggers the bug now?
Double fault in the keyboard server
That's interesting! Just adding the keyboard server got me into a double fault, i.e. an exception (probably a page fault) where the actual exception handler caused another exception. Here is the output:
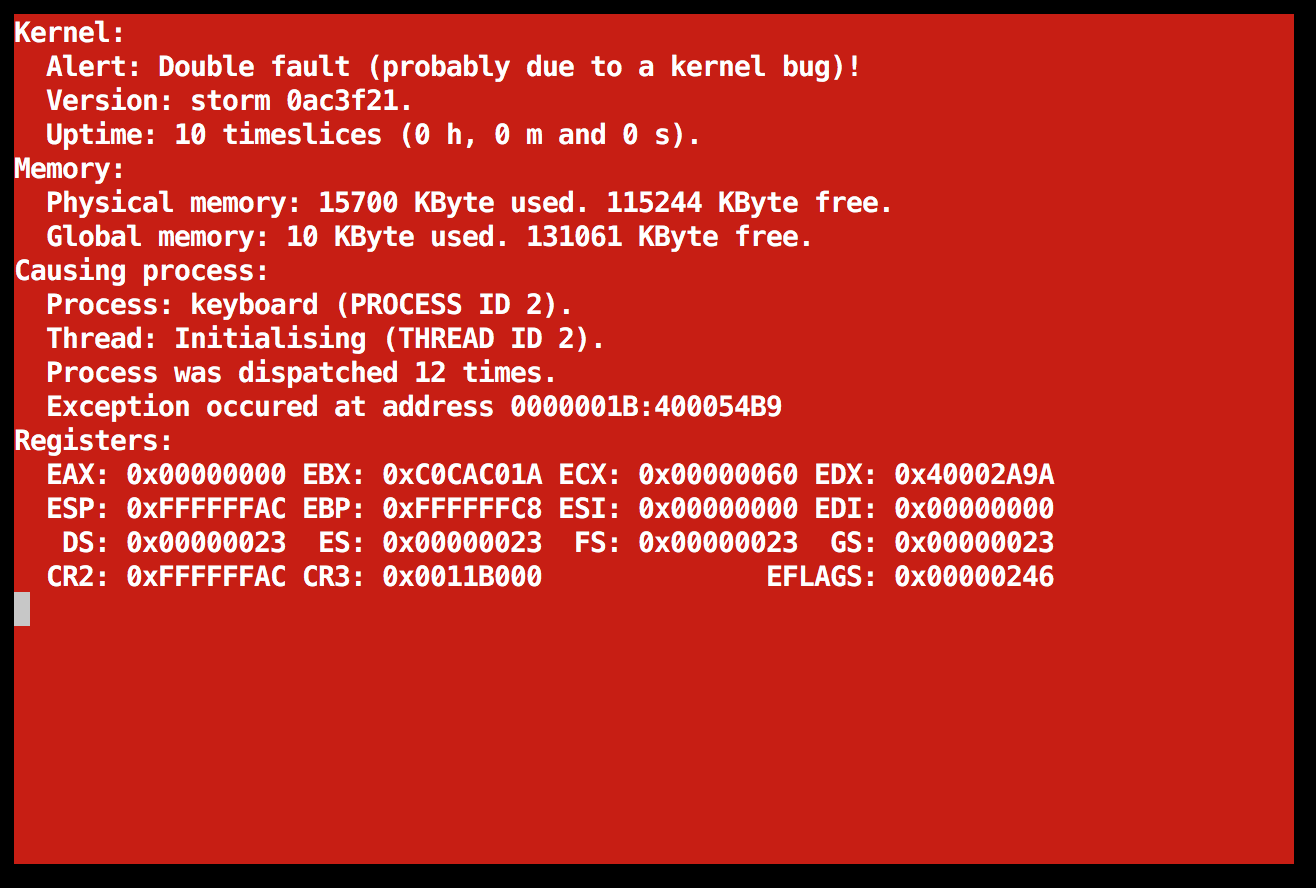
One can ask oneself sometimes: what drives you? What is that makes want to continue pursuing a seemingly impossible goal, when nothing in the circumstnaces currently indicates that you will be able to reach it? At the moment: a desire to understand why it goes wrong like this. If I won't solve this "puzzle", I will perhaps go thinking for years what could have been the reason!
The failing code doesn't look particularly fishy now:
400054a0 <system_thread_create>:
    asm volatile("pushl %1\n"
400054a0:       8b 44 24 08             mov    0x8(%esp),%eax
400054a4:       8b 54 24 04             mov    0x4(%esp),%edx
400054a8:       50                      push   %eax
400054a9:       52                      push   %edx
400054aa:       9a 00 00 00 00 68 02    lcall  $0x268,$0x0

        // Someone has added a return code in thread.c in the kernel without handling it in the system library. Please fix this in
        // the system library and send us a patch/pull request.
        default:
        {
            return SYSTEM_RETURN_THREAD_CREATE_FAILED;
400054b1:       85 c0                   test   %eax,%eax
400054b3:       0f 95 c0                setne  %al
400054b6:       0f b6 c0                movzbl %al,%eax
        }
    }
}
400054b9:       c3                      ret
400054ba:       8d b6 00 00 00 00       lea    0x0(%esi),%esi
I mean, ret (the second-last instruction). It tried to return after creating a thread. The CR2 is actually in fact equal to ESP which makes total sense: it was trying to return but the stack is currenly inaccessible, so it couldn't read the EIP to which it should return => fail.
I tried another approach: breaking inside thread_create, stepping more slowly through the code. And you know what? It managed to start the console and keyboard servers without any problems whatsoever! I just hate it when debugging changes the behavior of your code...
    Booting 'chaos 0.1.0'

kernel /storm
    [Multiboot-elf, <0x100000:0x16650:0xbb8>, shtab=0x118320, entry=0x100040]
module /servers/console.gz
    [Multiboot-module @ 0x159000, 0x16920 bytes]
module /servers/keyboard.gz
    [Multiboot-module @ 0x170000, 0x1b574 bytes]

Starting /storm (process ID 0).
storm 0.5.1+ booting...
Compiled by vagrant@debian-9rc1-i386 on Nov  7 2017 15:12:10 (revision 0ac3f21).

Machine: Celeron (Mendocino) at 829810837 Hz (~829 MHz).
Memory: Total 127 MB, kernel 2460 KB, reserved 384 KB, free 128100 KB.
VM subsystem initialized.
Global memory initialized.
ISA-based I/O initialized.
DMA initialized.
IPC initialized.
Thread subsystem initialized.
Process subsystem initialized.
Started /servers/console.gz (process ID 1).
Started /servers/keyboard.gz (process ID 2).
Interesting. So it's quite clearly a data race of some form. I think we'll do the "stupid" approach for now and just make it like this instead:
    cpu_interrupts_disable();
    mutex_kernel_wait(&memory_mutex);
    mutex_kernel_wait(&tss_tree_mutex);
    // ...do stuff...
    mutex_kernel_signal(&tss_tree_mutex);
    mutex_kernel_signal(&memory_mutex);
    cpu_interrupts_enable();
...i.e. mask all maskable interrupts (IRQ handlers, mostly) while the function is running. The function is seemingly poorly written, so that even locking the mutexes isn't enough, which is silly. Yeah, we could look into it further, but since this is a "side track" of our real task at hand right now, which is getting the bootup sequence working, I think we can live with it like this even though it is admittedly lame. Besides, large production systems like Ruby and previously even the Linux kernel had a "big kernel lock" back in the days. Obviously, if others have managed with a sub-optimal locking strategy, so can we.
Another double fault in the keyboard server
Sadly enough, even with this in place, I still got a double fault on startup:
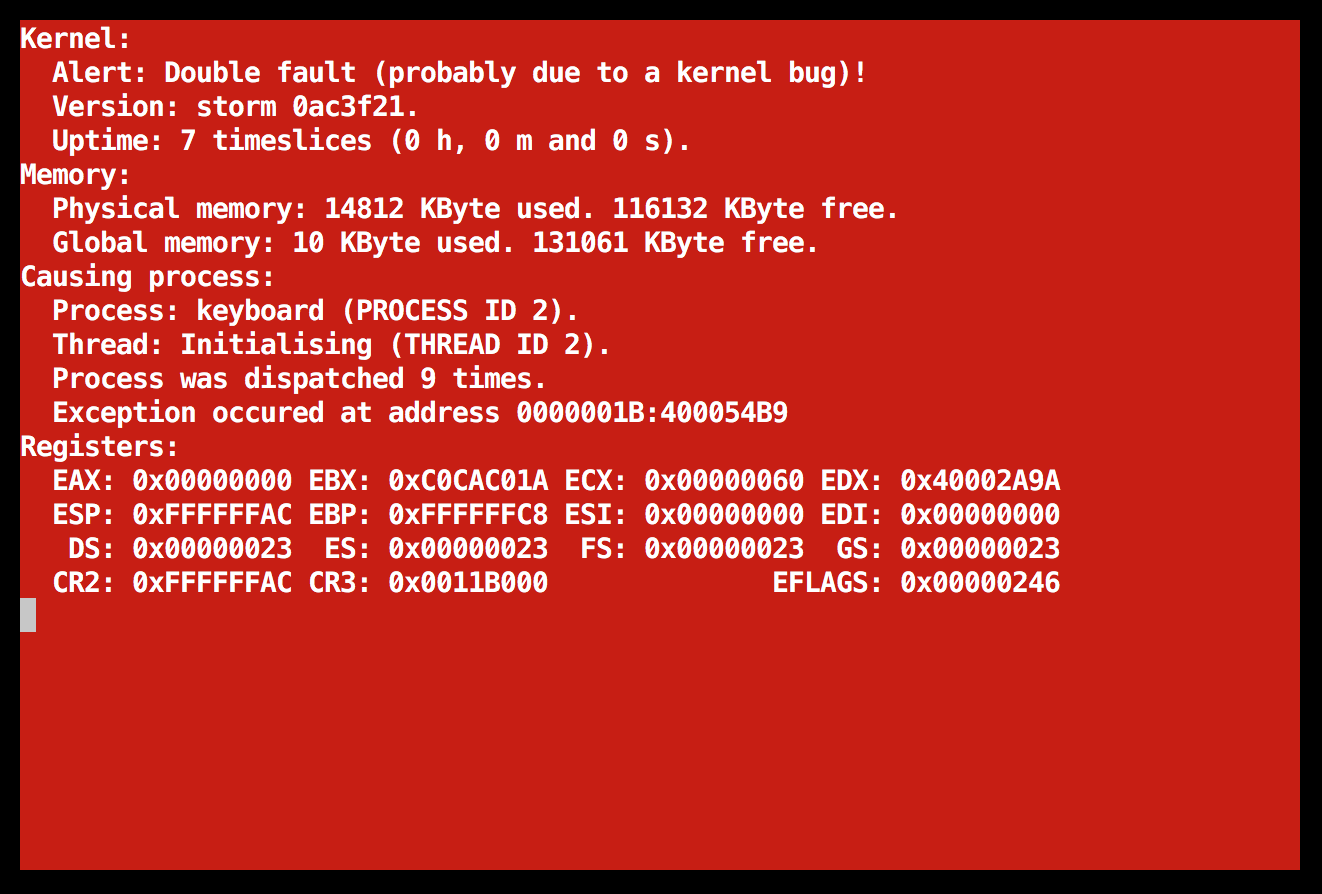
Looking at this, it seems very similar - but not entirely identical - to the last double fault. The timings (like "number of times dispatched" and "uptime" is different now, perhaps because of the locking/interrupts-related changes, perhaps for some other reason.
I decided to try and backtrack a bit in my git history, removing some of the recent changes. Working my way, a tiny step at a time, to something that perhaps works or at least breaks in a different way. ![]()
By removing the changes in dispatch_next that I had done, I got into another error. A page fault at 0x10A51C. Let's look at that code now:
dispatch.c:
238 {
239     // I had to split this to make it work. Otherwise, gcc would trash eax, which is pretty bad, to say the least. :-)
240     asm volatile ("pusha");
   0x0010a4ef <+0>: pusha

242     ("movl        32(%%esp), %%eax"
243      : "=a" (current_tss->instruction_pointer)
   0x0010a4f0 <+1>: mov    0x115e9c,%edx

244      : "m" (current_tss->instruction_pointer));
   0x0010a4f6 <+7>: mov    0x115e9c,%eax

241     asm volatile
   0x0010a4fb <+12>:    mov    0x20(%esp),%eax
   0x0010a4ff <+16>:    mov    %eax,0x158(%edx)

245
246     asm volatile
   0x0010a505 <+22>:    call   0x10a49b <dispatch_update>
   0x0010a50a <+27>:    mov    %al,%bl
   0x0010a50c <+29>:    mov    $0x20,%al
   0x0010a50e <+31>:    out    %al,$0x20
   0x0010a510 <+33>:    cmp    $0x1,%bl
   0x0010a513 <+36>:    je     0x10a51b <dispatch_task_switcher+44>
   0x0010a515 <+38>:    ljmp   *0x1168e0
   0x0010a51b <+44>:    popa
   0x0010a51c <+45>:    iret
This is the same error I had a while ago, failing at the iret instruction - returning from the interrupt handler. Something is obviously breaking this.
How about the compilation flags I added a while, to help debugging? Maybe they are breaking things somehow? Let's disable the -ggdb and -O0, and go with -O3 instead and see what happens!
Another illegal page fault :-)
This was the output now:
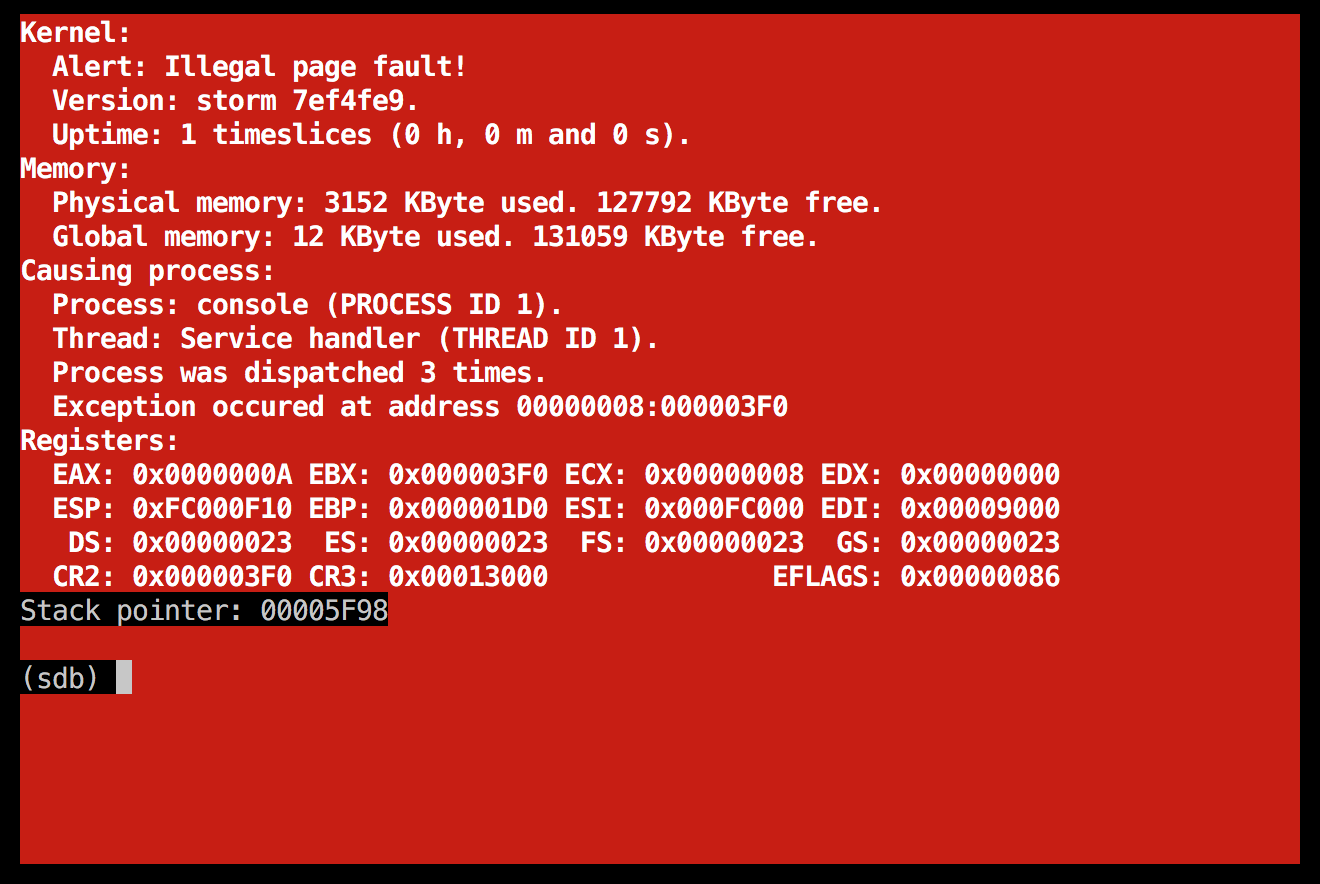
Well, it at least crashes at a different location right now...
I decided to try and approach my new "map page directories as page tables" code, and do some small change there. Maybe doing an insignificant change will help me to look at the code in an relaxed, comfortable way, eventually helping me see the obvious flaw in it? Sometimes you just need to "become friends" with your code, by spending time with it, getting to know its ins and outs.
Spending time with the code, looking at it from different angles
Setting the "present" flag to zero, gives me back the original problem (that I'm quite certain most of you have forgotten by now...) - an illegal page fault when trying to access address 0x02001F55.
But wait. Couldn't this be now that the problem is that it messes up this mapping in the memory_virtual_map_real method? There we have some code that looks like this:
        if (process_page_directory[page_directory_index].present == 0)
        {
            uint32_t page_table_page;

            // Page Table is not set up yet. Let's set up a new one.
            process_page_directory[page_directory_index].present = 1;
            process_page_directory[page_directory_index].flags = PAGE_DIRECTORY_FLAGS;
            process_page_directory[page_directory_index].accessed = 0;
Hmm, should be safe since the present flag will always be 1 in our case, so that block shouldn't get executed.
What about the thread_create method then, that was previously discussed at great length? I mean, we set this up whenever we create a new process but we don't do the same when we create a thread. Or do we copy the page directory to the thread's new page directory? Let's take a look!
    // Clone the page directory and the lowest page table.
    memory_copy((uint8_t *) new_page_directory, (uint8_t *) BASE_PROCESS_PAGE_DIRECTORY, SIZE_PAGE);
    memory_copy((uint8_t *) new_page_table, (uint8_t *) BASE_PROCESS_PAGE_TABLES, SIZE_PAGE);
I think I just had a revelation...
Do you see that second line? We copy from the BASE_PROCESS_PAGE_TABLES address, and write it to new_page_table. new_page_table in turn is a newly allocated page.
This is precisely the problem. Let's look at memory_virtual_create_page_tables_mapping again:
void memory_virtual_create_page_tables_mapping(page_directory_entry_page_table *other_process_page_directory, uint32_t page_directory_page)
{
    // The page tables page table is necessary for the kernel to be able to add page tables to this process at
    // runtime. By abusing the page directory as a page table, this clever hack should allow us to access all the
    // page tables very easily.
    int page_tables_page_directory_index = BASE_PROCESS_PAGE_TABLES / SIZE_PAGE / 1024;
    other_process_page_directory[page_tables_page_directory_index].present = 1;
    other_process_page_directory[page_tables_page_directory_index].flags = PAGE_DIRECTORY_FLAGS;
    other_process_page_directory[page_tables_page_directory_index].accessed = 0;
    other_process_page_directory[page_tables_page_directory_index].zero = 0;
    other_process_page_directory[page_tables_page_directory_index].page_size = 0;
    other_process_page_directory[page_tables_page_directory_index].global = 0;
    other_process_page_directory[page_tables_page_directory_index].available = 0;
    other_process_page_directory[page_tables_page_directory_index].page_table_base = page_directory_page;
}
This code is mapping that exact memory region into the page directory. So at the very least, this code is not needed any more (and should be done away with), but because of the really weird problems we're seeing right now, I think it's safe to assume that it's not just "meaningless"; it's actually "harmful".
Unfortunately, removing the setup of this page table didn't make a tiny bit of a difference. Still failing with CR2 being 0x000003F0.
What's odd there is that it says that "Process was dispatched 3 times" (it should say "thread", not process - I've fixed it but the screenshot was from before the change.) I mean, if the thread virtual memory mappings are completely broken, how has it managed to dispatch it even a single time?
I double-checked in thread_create and it does indeed reset the timeslices field; this could otherwise have been a bug but apparently we have this covered:
new_tss->timeslices = 0;
An old idea becoming new: validate VM mappings before applying them
Earlier on, I had thought about adding validation in memory_virtual_map_real to detect when the page table mappings were being manipulated. However, it felt complex and I wasn't completely sure of how to do it. The morning right after the last debugging above, I realized that it was trivial and would be a really good idea to add at this point. Let me explain: could it be that the mapping messes up the VM structures now?
I mean, think of it. The mapping methods are designed to work with proper PD/PT structures set up. But now, we have a singular PD that serves both as the PD and the PT. When thinking of this, I have the feeling that it should work as it is written now, but it sure won't hurt to add a bit of validation here. The good news is that it is, as stated, trivial. Here is the code now, with the validation if (page_directory_index == PROCESS_PAGE_TABLES_PAGE_DIRECTORY_INDEX) added:
    // ...

    for (counter = 0; counter < pages; counter++)
    {
        uint32_t page_directory_index = (virtual_page + counter) / 1024;

        if (page_directory_index == PROCESS_PAGE_TABLES_PAGE_DIRECTORY_INDEX)
        {
            DEBUG_HALT("Attempted to overwrite page table mapping. To map address %x, page directory index %u " \
                       "would have to be updated. This page directory index is reserved for page table mappings " \
                       "which cannot be set up using this method; they are handled by " \
                       "memory_virtual_create_page_tables_mapping", (virtual_page + counter) * SIZE_PAGE,
                       page_directory_index);
        }

        // ...
(Arguably a very long message, but in this case I think it makes sense to help my future self a bit by reminding him about how this code works. He will thank me one day. ![]() )
)
When adding this code, this is what I got on system startup now:
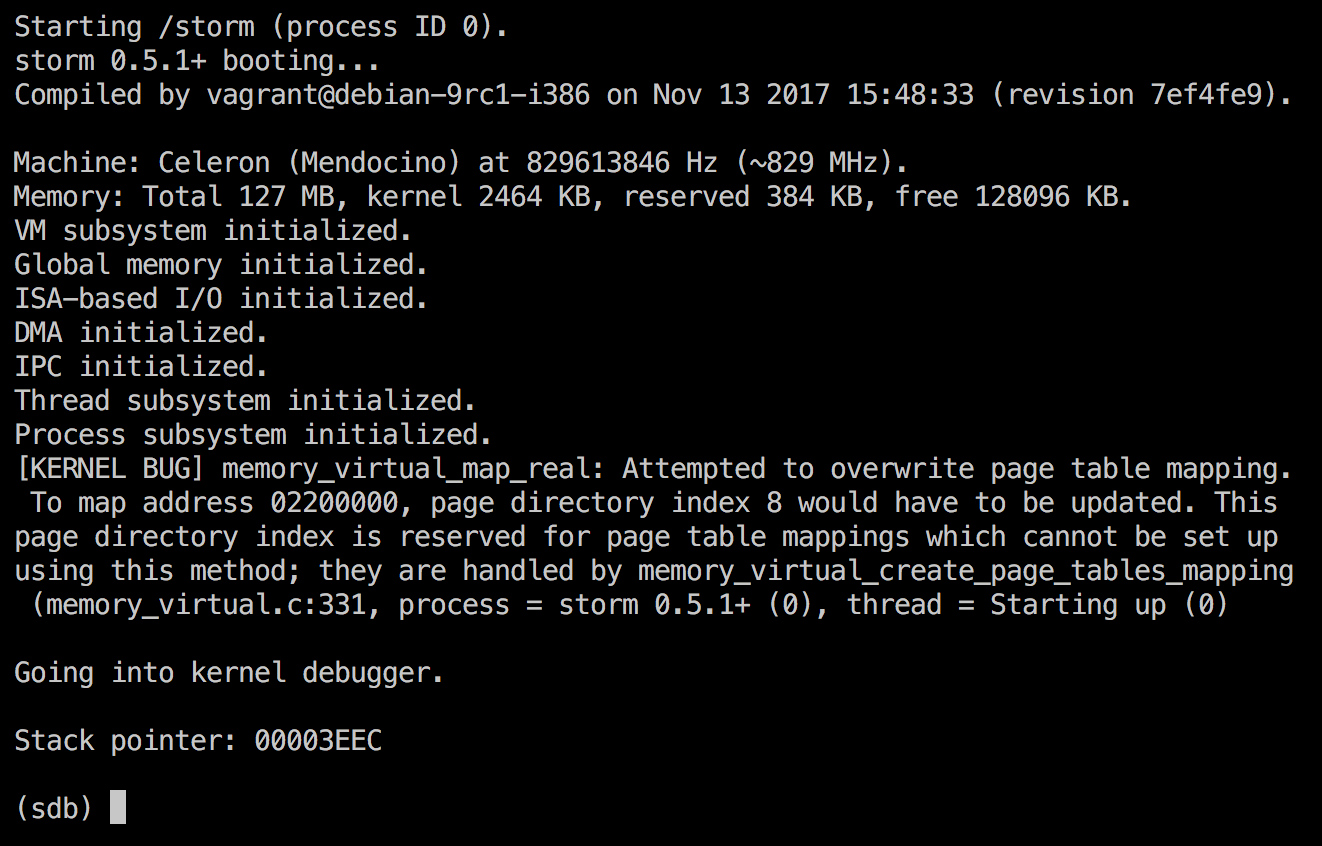
Very promising! This is much better than all these silly page faults that makes you want to throw out the machine through the window. I added a gdb breakpoint to break on this source line now, so that I could see from where it was being called.
This was the call stack:
Breakpoint 1, memory_virtual_map_real (virtual_page=10562, physical_page=9, pages=1, flags=0) at memory_virtual.c:336
336         if (process_page_directory[page_directory_index].present == 0)
(gdb) bt full
#0  memory_virtual_map_real (virtual_page=10562, physical_page=9, pages=1, flags=0) at memory_virtual.c:336
        page_directory_index = 10
        page_table_index = 1
        page_table = 0x2802258
        counter = 0
        __FUNCTION__ = "memory_virtual_map_real"
#1  0x00105b28 in memory_virtual_map (virtual_page=10562, physical_page=9, pages=1, flags=0) at memory_virtual.c:528
        return_value = 41951832
#2  0x001007d8 in memory_global_init () at memory_global.c:56
        physical_page = 9
#3  0x001004fc in kernel_main (arguments=1, argument=0x1174e4 <arguments_kernel+4>) at main.c:200
        __FUNCTION__ = "kernel_main"
        servers_started = 0
#4  0x00100120 in kernel_entry () at init.c:163
No locals.
The code in question looks like this, somewhat simplified:
// Initialise the global memory heap.
void memory_global_init(void)
{
    uint32_t physical_page;
    memory_physical_allocate(&physical_page, 1, "Global AVL memory tree");

    memory_virtual_map(GET_PAGE_NUMBER(BASE_GLOBAL_MEMORY_TREE),
                       physical_page, 1, PAGE_KERNEL);
BASE_GLOBAL_MEMORY_TREE is 0x2942000. Using our little indexes.rb script again, I got this output:
$ ./indexes.rb 0x2942000
PD index: 10
PT index: 322
That's interesting; this address itself is not being mapped via PD index 8, but through PD index 10.
I then realized I had messed things up; the source line in question was not the DEBUG_HALT line but a few source lines later... Doh! The line being printed when booting up was memory_virtual.c:331, but it was in fact breaking at memory_virtual.c:336 as can be seen in the stack trace above. Thank you gdb for that "help"...
Recreating the breakpoint and finding the proper call stack
I recreated the breakpoint at memory_virtual.c:327 and got this, which made a lot more sense:
Breakpoint 3, memory_virtual_map_real (virtual_page=8704, physical_page=17, pages=1, flags=0) at memory_virtual.c:327
327             DEBUG_HALT("Attempted to overwrite page table mapping. To map address %x, page directory index %u " \
(gdb) bt full
#0  memory_virtual_map_real (virtual_page=8704, physical_page=17, pages=1, flags=0) at memory_virtual.c:327
        page_directory_index = 8
        page_table_index = 59548
        page_table = 0xf
        counter = 0
        __FUNCTION__ = "memory_virtual_map_real"
#1  0x001055db in memory_virtual_map_real (virtual_page=524288, physical_page=345, pages=23, flags=0) at memory_virtual.c:363
        page_table_page = 17
        page_directory_index = 512
        page_table_index = 0
        page_table = 0x16
        counter = 0
        __FUNCTION__ = "memory_virtual_map_real"
#2  0x00105b28 in memory_virtual_map (virtual_page=524288, physical_page=345, pages=23, flags=0) at memory_virtual.c:528
        return_value = 31
#3  0x00100623 in kernel_main (arguments=1, argument=0x1174e4 <arguments_kernel+4>) at main.c:223
        index = 0
        __FUNCTION__ = "kernel_main"
        servers_started = 0
#4  0x00100120 in kernel_entry () at init.c:163
No locals.
This makes sense; we're now in the middle of this section in the code:
            // Page Table is not set up yet. Let's set up a new one.
            process_page_directory[page_directory_index].present = 1;
            process_page_directory[page_directory_index].flags = PAGE_DIRECTORY_FLAGS;
            process_page_directory[page_directory_index].accessed = 0;
            process_page_directory[page_directory_index].zero = 0;
...etc. This is the code that previously has been calling itself recursively. This should no longer be needed now, since by setting up the page in the page directory, the page table should also be magically available. (Hmm, didn't I try getting rid of this already, a few hundred lines ago? ![]() )
)
Illegal page fault in the kernel process
Doing this change, compiling and rebooting the simulator gave me this:
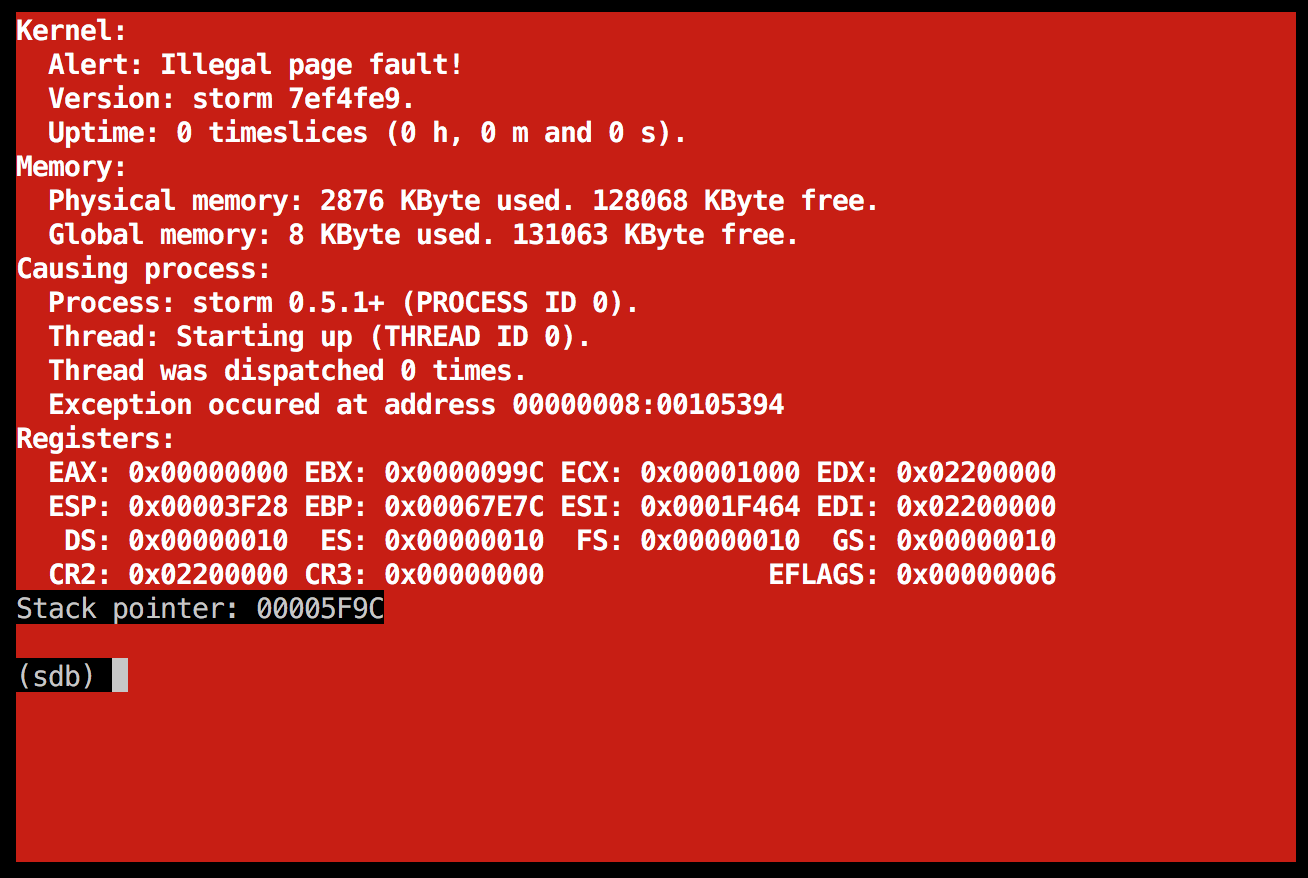
Again using the indexes.rb script, that boils down to:
$ ./indexes.rb 0x02200000
PD index: 8
PT index: 512
Dumping some dwords from the stack (x/16x 0x00003F28) gave me the value 0x001055ce which seemed to be a procedure in the kernel. I'm fairly sure that the problem is this call; let's see if I'm right:
            // Because of the magic page directory entry set up in memory_virtual_create_page_tables_mapping, the page table is accessible right away without any
            // further mapping.
            memory_set_uint8_t((uint8_t *)(BASE_PROCESS_PAGE_TABLES + (page_directory_index * SIZE_PAGE)), 0, SIZE_PAGE);
Disassembling the 0x001055ce location confirmed my suspicion. So, here are some facts:
-
0x02200000=BASE_PROCESS_PAGE_TABLES + (page_directory_index * SIZE_PAGE)), 0, SIZE_PAGE -
page_directory_index== 8. Or is it 512? The correct answer is: both! The page directory index is 8, for all the page tables. The page table index inside the page directory (remember, we are abusing the page directory as a page table also) is 512.
I started looking at the previous stack trace a bit more, and I see something really weird going on now:
#0  memory_virtual_map_real (virtual_page=8704, physical_page=17, pages=1, flags=0) at memory_virtual.c:327
        page_directory_index = 8
        page_table_index = 59548
        page_table = 0xf
        counter = 0
        __FUNCTION__ = "memory_virtual_map_real"
page_table_index having a value of 59548? That's impossible, but I wonder if this is now just a matter of an uninitialized variable or if it's indeed a bug.
I looked at the code and concluded that this is just a variable not yet having its value initialized, so it's nothing to care about.
From what I can tell, the code should indeed work. Let's break memory_virtual.c:363 if page_directory_index == 512 and see if we can catch it right before it goes kaboom now.
Looking further at the page directory data
Yes, no problem. So now what we really want to do it to look at the page directory entry 512 and see what it looks like:
Breakpoint 1, memory_virtual_map_real (virtual_page=524288, physical_page=345, pages=23, flags=0) at memory_virtual.c:363
363             memory_set_uint8_t((uint8_t *)(BASE_PROCESS_PAGE_TABLES + (page_directory_index * SIZE_PAGE)), 0, SIZE_PAGE);
(gdb) x/16x &process_page_directory[512]
0x1800: 0x00011007  0x00000000  0x00000000  0x00000000
0x1810: 0x00000000  0x00000000  0x00000000  0x00000000
0x1820: 0x00000000  0x00000000  0x00000000  0x00000000
0x1830: 0x00000000  0x00000000  0x00000000  0x00000000
Looks basically sane; the entry points at memory address 0x00011000 with the Present (1), Read/Write (2), User/Supervisor (4) bits set.
How about the self-referencing page directory entry then? (the value at 0x1020)
(gdb) x/4x &process_page_directory[8]
0x1020: 0x00006027  0x00000000  0x0018c127  0x0018d107
Points at memory address 0x00006000 with the same flags as above set, plus also the Accessed (0x20) bit set.
Looking at this memory address in the qemu monitor again looks sane:
(qemu) xp /16wx 0x6000
0000000000006000: 0x00005001 0x00000000 0x00000000 0x00000000
0000000000006010: 0x00000000 0x00000000 0x00000000 0x00000000
0000000000006020: 0x00006001 0x00000000 0x0018c061 0x0018d001
0000000000006030: 0x0018e001 0x0018f001 0x00190001 0x00191001
In gdb:
(gdb) x/16x &process_page_directory[0]
0x1000: 0x00005027  0x00000000  0x00000000  0x00000000
0x1010: 0x00000000  0x00000000  0x00000000  0x00000000
0x1020: 0x00006027  0x00000000  0x0018c127  0x0018d107
0x1030: 0x0018e107  0x0018f107  0x00190107  0x00191107
Looks very similar. The flags are surprisingly different (0x6027 vs 0x6001), but this could be a gdb/debugging issue. It seems that this is the very same page we're looking at now.
The page directory entry 512 in qemu, then?
(qemu) xp /16wx 0x6800
0000000000006800: 0x00000000 0x00000000 0x00000000 0x00000000
0000000000006810: 0x00000000 0x00000000 0x00000000 0x00000000
0000000000006820: 0x00000000 0x00000000 0x00000000 0x00000000
0000000000006830: 0x00000000 0x00000000 0x00000000 0x00000000
This is super-strange, really! Again, in GDB:
(gdb) x/16x &process_page_directory[512]
0x1800: 0x00011007  0x00000000  0x00000000  0x00000000
0x1810: 0x00000000  0x00000000  0x00000000  0x00000000
0x1820: 0x00000000  0x00000000  0x00000000  0x00000000
0x1830: 0x00000000  0x00000000  0x00000000  0x00000000
Do you see it now? The virtual address has the new value (0x00011007), but the physical address does not (0x00000000). It's extremely likely that this is exactly why it's not working. But why and how can this be happening?
Inspecting the CPU registers and finally understanding what is going on
I started looking around some more. info registers is a very useful command. It works in both gdb and in qemu, but it gives even more information in the qemu monitor since it has more access to the (simulated) hardware. Here is what it gave me:
ES =0010 00000000 ffffffff 00cf9300 DPL=0 DS   [-WA]
CS =0008 00000000 ffffffff 00cf9800 DPL=0 CS32 [---]
SS =0010 00000000 ffffffff 00cf9300 DPL=0 DS   [-WA]
DS =0010 00000000 ffffffff 00cf9300 DPL=0 DS   [-WA]
FS =0010 00000000 ffffffff 00cf9300 DPL=0 DS   [-WA]
GS =0010 00000000 ffffffff 00cf9300 DPL=0 DS   [-WA]
LDT=0000 00000000 0000ffff 00008200 DPL=0 LDT
TR =002b 0000a000 00000160 00008900 DPL=0 TSS32-avl
GDT=     0000b000 000007ff
IDT=     0000b800 000007ff
CR0=80000011 CR2=00000000 CR3=00000000 CR4=00000080
DR0=00000000 DR1=00000000 DR2=00000000 DR3=00000000
DR6=ffff0ff0 DR7=00000400
EFER=0000000000000000
FCW=037f FSW=0000 [ST=0] FTW=00 MXCSR=00001f80
FPR0=0000000000000000 0000 FPR1=0000000000000000 0000
FPR2=0000000000000000 0000 FPR3=0000000000000000 0000
FPR4=0000000000000000 0000 FPR5=0000000000000000 0000
FPR6=0000000000000000 0000 FPR7=0000000000000000 0000
XMM00=00000000000000000000000000000000 XMM01=00000000000000000000000000000000
XMM02=00000000000000000000000000000000 XMM03=00000000000000000000000000000000
XMM04=00000000000000000000000000000000 XMM05=00000000000000000000000000000000
XMM06=00000000000000000000000000000000 XMM07=00000000000000000000000000000000
(qemu)
This is crazily interesting. CR3 is the address of the page directory being used, and it is seemingly zero in this case.
In other words, it's not at all the 0x00006000 we were assuming. If we inspect this memory page now, I'm quite sure we will find something interesting:
(qemu) xp /16wx 0
0000000000000000: 0x00005027 0x00000001 0x00000000 0x00000000
0000000000000010: 0x00000000 0x00000000 0x00000000 0x00000000
0000000000000020: 0x00006027 0x00000000 0x0018c127 0x0018d107
0000000000000030: 0x0018e107 0x0018f107 0x00190107 0x00191107
Makes sense, thank you for that qemu. Now we're looking at the same page in qemu and gdb. So, to conclude:
- We are in fact using a page directory located at the physical zero page (
0x00000000) for the current task. - The
memory_virtual_map_realassumes that we are using a page directory located at physical address0x00006000. - It sets up a mapping in that page directory for a new page table being created.
- When it is accessed, a page fault occurs because the mapping doesn't exist in the currently active page directory.
Makes perfect sense now!
Why the wrong page directory?
So the next question then: why are we not using the page directory that the method is expecting?
It might be as simple as the kernel page directory not being mapped at the BASE_PROCESS_PAGE_DIRECTORY address. Instead, something else is mapped there, "masquerading" itself as the kernel page directory. Vicious indeed! ![]()
The code we're dealing with now is being called from the kernel startup phase, from the "kernel process" if you like. Let's repeat the stack trace once more since it was so long since I last showed it:
#1  0x001055db in memory_virtual_map_real (virtual_page=524288, physical_page=345, pages=23, flags=0) at memory_virtual.c:363
        page_table_page = 17
        page_directory_index = 512
        page_table_index = 0
        page_table = 0x16
        counter = 0
        __FUNCTION__ = "memory_virtual_map_real"
#2  0x00105b28 in memory_virtual_map (virtual_page=524288, physical_page=345, pages=23, flags=0) at memory_virtual.c:528
        return_value = 31
#3  0x00100623 in kernel_main (arguments=1, argument=0x1174e4 <arguments_kernel+4>) at main.c:223
        index = 0
        __FUNCTION__ = "kernel_main"
        servers_started = 0
#4  0x00100120 in kernel_entry () at init.c:163
No locals.
The kernel_main code here is dealing with the command line arguments, and that's when it fails.
Here is the code that maps the page directory page for the kernel process:
    // Page directory.
    memory_virtual_map_paging_disabled(
        kernel_page_directory,
        GET_PAGE_NUMBER(BASE_PROCESS_PAGE_DIRECTORY),
        GET_PAGE_NUMBER((uint32_t) kernel_page_directory),
        1,
        PAGE_KERNEL
    );
I looked at this code in the debugger, which didn't give me any immediate ideas (apart from that "Aha!" thought, thinking you had found a problem, to just realize the moment after that you were wrong...)
But then I had an interesting idea, again looking at the process_page_directory dumps from a while ago.
Page directory entry 8 (i.e. the 9th entry) in the real page directory points at address 0x00006000. This is indeed incorrect, since the real physical page for the page directory is 0x00000000 right now. That will mess everything up, since the memory_virtual_map_real will then go and update the "wrong" page directory, causing this illegal page fault in the end.
So where is page directory entry 8 set up for the kernel? It's not set up using the memory_virtual_create_page_tables_mapping, since I haven't added any such call for the kernel process. And that's probably exactly why it's failing. I haven't fixed the "self-referential" mapping for the kernel process, and that needs to be done now.
Adding the missing code, trying to get it working with the existing codebase
After looking at the code for a while, I think I have it now... It's set up in memory_virtual_init. But the annoying thing is that it seems to be intertwined with the "global memory" concept:
Maybe if I remove this code first:
        // Map the shared page tables.
        memory_virtual_map_paging_disabled(
            kernel_page_directory,
            GET_PAGE_NUMBER(BASE_PROCESS_PAGE_TABLES) + index,
            GET_PAGE_NUMBER(shared_page_tables) + counter,
            1,
            PAGE_KERNEL
        );
...and if that works, replace it with a call to memory_virtual_create_page_tables_mapping, could that possibly work or will it break the global memory concept completely?
It seems so; the kernel reboots immediately on startup when I remove this code at least. ![]()
However, adding memory_virtual_create_page_tables_mapping actually made it pass, at least as far as to run without crashing... A decent first step. Allow me to rephrase the good old saying:
If it compiles, ship it!
...to its kernel-development form:
If it doesn't crash on startup, ship it!
![]()
KERNEL BUG: Attempted to overwrite page table mapping
So... It doesn't crash on startup right there any more, but it produces another error now:
Starting /storm (process ID 0).
storm 0.5.1+ booting...
Compiled by vagrant@debian-9rc1-i386 on Nov 18 2017 16:06:54 (revision 7ef4fe9).

Machine: Celeron (Mendocino) at 829764346 Hz (~829 MHz).
Memory: Total 127 MB, kernel 2460 KB, reserved 384 KB, free 128100 KB.
VM subsystem initialized.
Global memory initialized.
ISA-based I/O initialized.
DMA initialized.
IPC initialized.
Thread subsystem initialized.
Process subsystem initialized.
[KERNEL BUG] memory_virtual_map_other_real: Attempted to overwrite page table ma
pping. To map address 02000000, page directory index 8 would have to be updated.
This page directory index is reserved for page table mappings which cannot be s
et up using this method; they are handled by memory_virtual_create_page_tables_m
apping (memory_virtual.c:430, process = storm 0.5.1+ (0), thread = Starting up (
0)

Going into kernel debugger.
Putting a gdb breakpoint at that line indicates that it's the ELF execution that is now failing, more specifically like this:
(gdb) bt
#0  memory_virtual_map_other_real (tss=0xe89d018, virtual_page=8192, physical_page=20, pages=1, flags=0) at memory_virtual.c:426
#1  0x00105946 in memory_virtual_map_other_real (tss=0xe89d018, virtual_page=1, physical_page=19, pages=1, flags=0)
    at memory_virtual.c:455
#2  0x00105b2a in memory_virtual_map_other (tss=0xe89d018, virtual_page=1, physical_page=19, pages=1, flags=0) at memory_virtual.c:534
#3  0x00107352 in process_create (process_data=0x3f44) at process.c:204
#4  0x001026fa in elf_execute (image=0x80000000 "\177ELF\001\001\001", parameter_string=0x4000 "/servers/console.gz",
    process_id=0x102d00 <server_process_id>) at elf.c:177
#5  0x00100648 in kernel_main (arguments=1, argument=0x1174c4 <arguments_kernel+4>) at main.c:228
#6  0x00100120 in kernel_entry () at init.c:163
It turned out the code looked like this:
        // Page Table is not yet set up.
        if (page_directory[page_directory_index].present == 0)
        {
            uint32_t page_table_page;

            DEBUG_MESSAGE(DEBUG, "page_directory[index].present == 0");

            // FIXME: Check return value.
            memory_physical_allocate(&page_table_page, 1, "Page table.");

            // Let's set up a new page table.
            page_directory[page_directory_index].present = 1;
            page_directory[page_directory_index].flags = PAGE_DIRECTORY_FLAGS;
            page_directory[page_directory_index].accessed = 0;
            page_directory[page_directory_index].zero = 0;
            page_directory[page_directory_index].page_size = 0;
            page_directory[page_directory_index].global = 0;
            page_directory[page_directory_index].available = 0;
            page_directory[page_directory_index].page_table_base = page_table_page;

            memory_virtual_map_other_real(
                tss,
                GET_PAGE_NUMBER(BASE_PROCESS_PAGE_TABLES) + page_directory_index,
                (uint32_t) page_directory[page_directory_index].page_table_base,
                1,
                PAGE_KERNEL
            );
The code there at the end is the same kind of code that we removed in memory_virtual_map_real. I.e., it makes the assumption that we have to do special things to make a page table be mapped inside the BASE_PROCESS_PAGE_TABLES zone, which is no longer the case. Let's just remove that call and see what happens.
Same error, but coming from a different line in process.c
Similar error again, but different stack trace:
Breakpoint 1, memory_virtual_map_other_real (tss=0xe89d018, virtual_page=8202, physical_page=396, pages=1, flags=0)
    at memory_virtual.c:426
426             DEBUG_HALT("Attempted to overwrite page table mapping. To map address %x, page directory index %u " \
(gdb) bt
#0  memory_virtual_map_other_real (tss=0xe89d018, virtual_page=8202, physical_page=396, pages=1, flags=0) at memory_virtual.c:426
#1  0x00105af4 in memory_virtual_map_other (tss=0xe89d018, virtual_page=8202, physical_page=396, pages=1, flags=0)
    at memory_virtual.c:529
#2  0x00107bea in process_create (process_data=0x3f44) at process.c:451
#3  0x001026fa in elf_execute (image=0x80000000 "\177ELF\001\001\001", parameter_string=0x4000 "/servers/console.gz",
    process_id=0x102d00 <server_process_id>) at elf.c:177
#4  0x00100648 in kernel_main (arguments=1, argument=0x117484 <arguments_kernel+4>) at main.c:228
#5  0x00100120 in kernel_entry () at init.c:163
The code that is failing is, again, related to the "shared page tables" concept:
        // Map the shared page tables.
        memory_virtual_map_other(process_tss,
                                 GET_PAGE_NUMBER(BASE_PROCESS_PAGE_TABLES) +
                                 index,
                                 GET_PAGE_NUMBER(shared_page_tables) + counter,
                                 1, PAGE_KERNEL);
Let's kill these lines for now and see; likely, the kernel will crash when the process is launched because we have now essentially removed the shared page tables from the page directory.
Imagine the surprised look at my face when I saw this on system startup now:
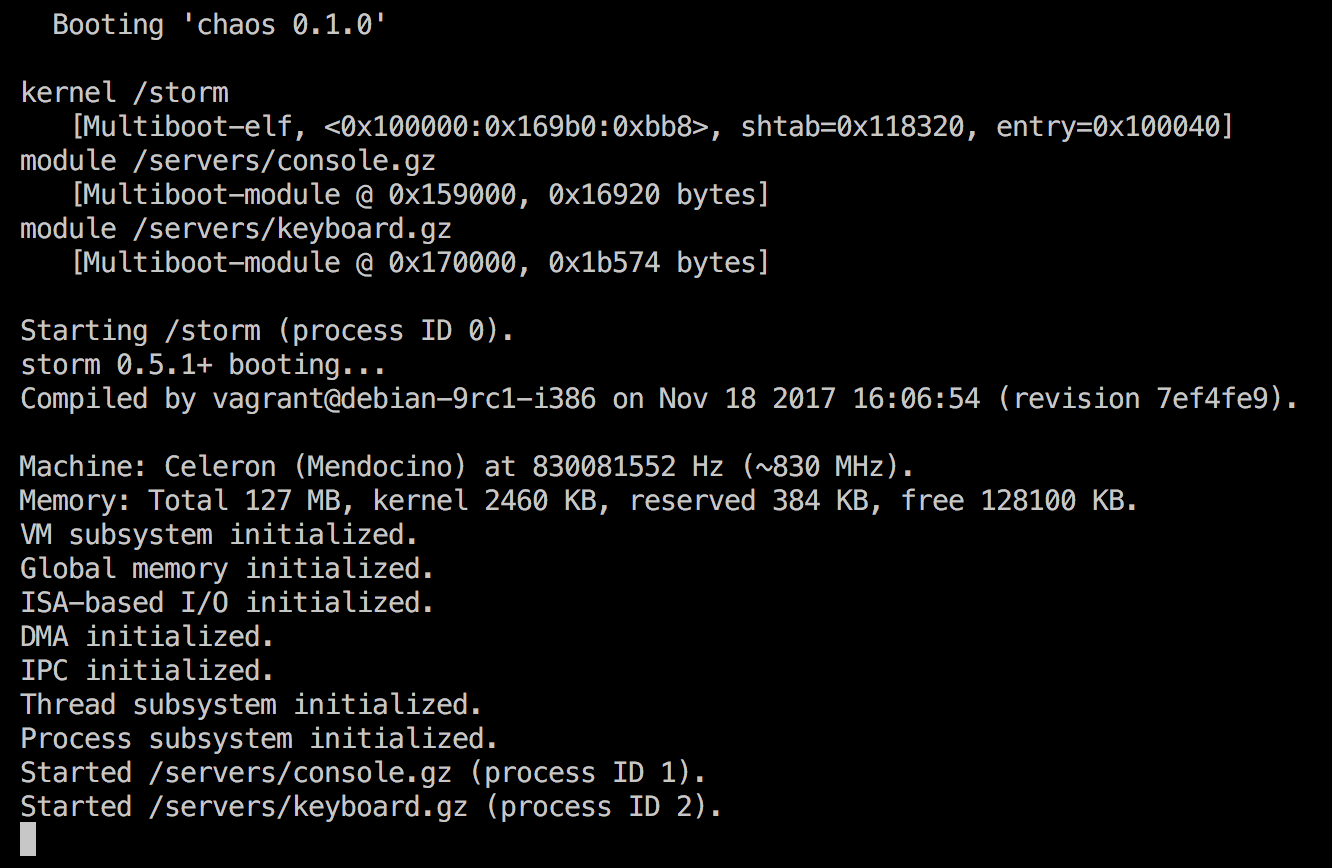
No error! That's a bit surprising. Let's take back all the other servers now as well, and see what we get.
(I realized later when AFK that this is not so strange, since it's only the page table zone mapping that we disable here, so it should still work until it tries to do any mappings when the process is running. That's the theory I had at least, and I confirmed it now when back at the machine.)
Illegal page fault in the virtual_file_system server
This is the not-so-surprising screen that welcomed me on startup now, after actually running for a few seconds without crashing:
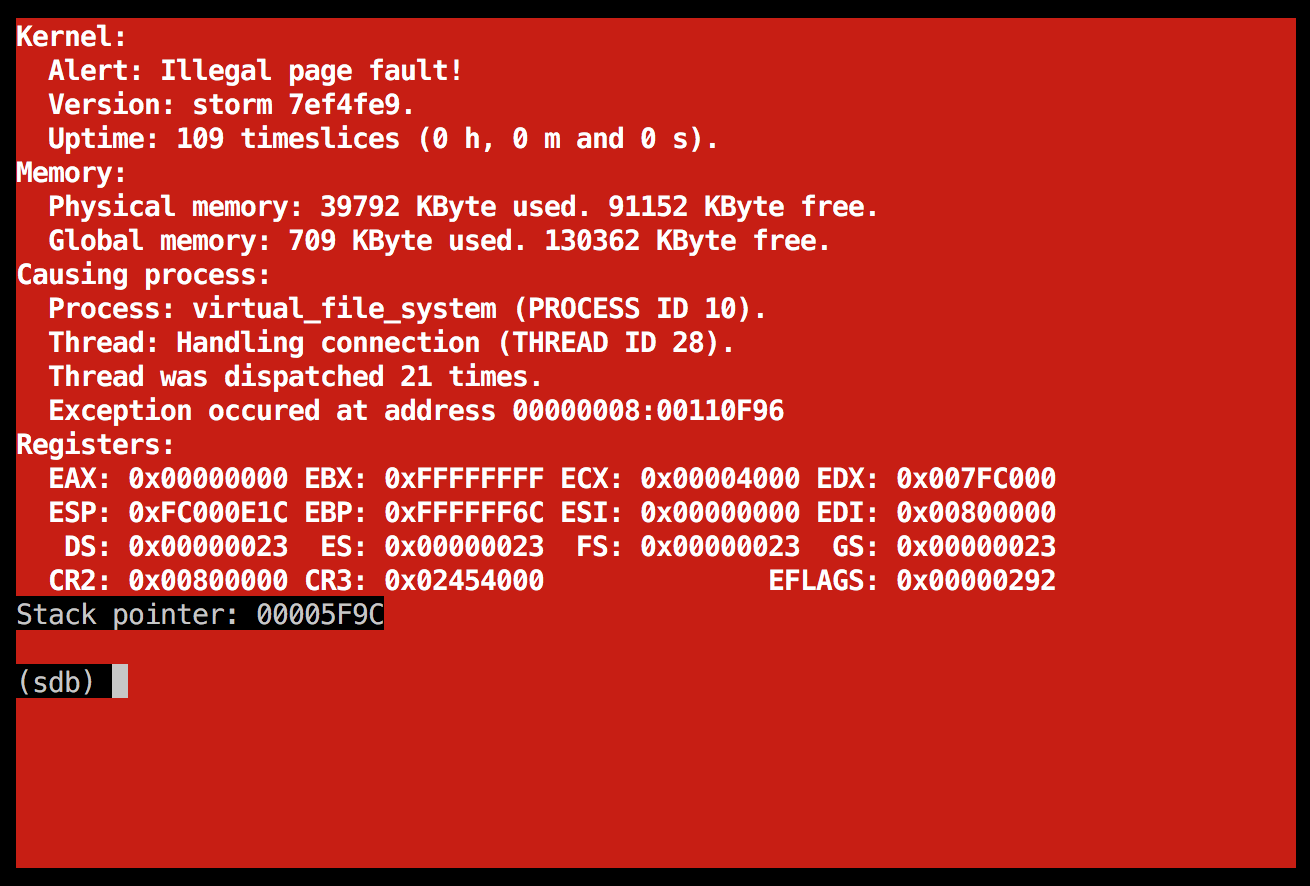
This is interesting; it doesn't seem to be in the "global memory" zone. The disassembled source for the EIP location in gdb indicates that this is memory_set_uint8_t being called. Unfortunately, I can't seem to be able to dump memory at the ESP location now, perhaps because it's switched page directory from the process' own one to the trap handlers' page directory. Gha, the debugging experience sucks big-time with these kind of things sometimes!
Let's reenable cludio startup using the "old way", i.e. starting it from GRUB's menu.lst file.
Hmm, this is weird. Here is what I get now:
Starting /storm (process ID 0).
storm 0.5.1+ booting...
Compiled by vagrant@debian-9rc1-i386 on Nov 20 2017 16:00:00 (revision 561ccd1).

Machine: Celeron (Mendocino) at 829778132 Hz (~829 MHz).
Memory: Total 127 MB, kernel 20060 KB, reserved 384 KB, free 110500 KB.
VM subsystem initialized.
Global memory initialized.
ISA-based I/O initialized.
DMA initialized.
IPC initialized.
Thread subsystem initialized.
Process subsystem initialized.
Started /servers/console.gz (process ID 1).
Started /servers/keyboard.gz (process ID 2).
Started /servers/vga.gz (process ID 3).
Started /servers/log.gz (process ID 4).
Started /servers/fat.gz (process ID 5).
Started /servers/initial_ramdisk.gz (process ID 6).
Started /servers/loopback.gz (process ID 7).
Started /servers/ipv4.gz (process ID 8).
Started /servers/pci.gz (process ID 9).
Started /servers/virtual_file_system.gz (process ID 10).
Started /programs/cluido.gz (process ID 11).
Then it hangs. Absolutely nothing more. Have I disabled something critical that breaks something? In general, I have a feeling that I might have some "isolated chunk" of functionality that could make its way into master now, since I've been more or less "frestyle hacking" for weeks here...
I looked at the GitHub PR preview:
Showing 50 changes files with 567 additions and 389 deletions.
Yeah, that's right. Sure, a PR can span over a couple of files, sometimes more, but this is really a case of where we can and should try and split things up so we can get some of the progress we've made thus far merged.
Cherry-picking changes from my branch into separate, isolated PRs
I created and merged the following PRs:
- #109: Rake: Recreate the ramdisk image on each rake install
- #110: Misc copyright fixes
- #111: Bug fix: The FAT server should handle modern FAT16 volumes
This gave me a slightly smaller diff, which is nice so I can now focus more on my bug. I decided to try and tackle the exception in the debugger this time:
(gdb) break *0x00110F96 if address == 0x024540003
Note: breakpoint 3 (disabled) also set at pc 0x110f96.
Breakpoint 4 at 0x110f96: file ../include/storm/current-arch/memory.h, line 95.
(gdb) cont
Continuing.
It took a long time to run now, since this was a method that was being called many times during the initialization of the system.
Unfortunately, the breakpoint was not triggered; perhaps the address being passed to this method wasn't actually that, but it was part of the memory range being updated by the method.
I wrote earlier that I wasn't able to dump the stack contents here, because it had switched from the PL3 to the PL0 stack. Let's do it the hard way now, by calculating the page directory and page table indices for the ESP address (0xFC000E1C):
vagrant@debian-9rc1-i386:/vagrant$ ./storm/indexes.rb 0xFC000E1C
PD index: 1008
PT index: 0
Looking at this page directory entry indicates that it is unmapped, which seems strange and unexpected:
(gdb) print process_page_directory[1008]
$1 = {present = 0, flags = 0, accessed = 0, zero = 0, page_size = 0, global = 0, available = 0, page_table_base = 0}
Are we looking at the right memory? Let's inspect it in gdb and qemu again and compare:
(gdb) print process_page_directory
$6 = (page_directory_entry_page_table *) 0x1000
(gdb) x/16x 0x1000
0x1000: 0x00005067  0x02303067  0x02304067  0x02305067
0x1010: 0x02306067  0x00000000  0x00000000  0x00000000
0x1020: 0x00000023  0x00000000  0x0129c161  0x0129d101
0x1030: 0x0129e101  0x0129f101  0x012a0101  0x012a1101

(qemu) xp/16wx 0x00800000
0000000000800000: 0x00000000 0x00000000 0x00000000 0x00000000
0000000000800010: 0x00000000 0x00000000 0x00000000 0x00000000
0000000000800020: 0x00000000 0x00000000 0x00000000 0x00000000
0000000000800030: 0x00000000 0x00000000 0x00000000 0x00000000
Nope, not very similar at all. This was the time when I realized I was messing up CR2 and CR3... CR2 is the failing address in this case, NOT CR3... :rage4: We are humans, and humans can obviously sometimes make terrible mistakes. I just did one.
Getting back on track, looking at the right memory address instead
This means that the failing memory access was 0x00800000 and nothing else. This memory is being referred to in the Virtual memory overview as "Process' low-level memory allocation structures."
Looking at the actual page directory instead in qemu gave me this now:
(qemu) xp/16wx 0x02453000
0000000002453000: 0x02374067 0x023c6067 0x00000000 0x00000000
0000000002453010: 0x00000000 0x00000000 0x00000000 0x00000000
0000000002453020: 0x02373023 0x00000000 0x0129c123 0x0129d103
0000000002453030: 0x0129e103 0x0129f103 0x012a0103 0x012a1103
Looks better, in the sense that it's not just all zeroes and it could be a page directory. But why is there no resemblance to the process_page_directory data? It seems like some other page is being mapped into that memory region...
Let's look at the mapping for process_page_directory then:
vagrant@debian-9rc1-i386:/vagrant$ ./storm/indexes.rb 0x1000
PD index: 0
PT index: 1
So that means we should be looking at the first page directory entry, and the seceond page table. The qemu dump above indicates that 0x2374000 is the proper base address for this page directory.
(qemu) xp/16wx 0x2374000
0000000002374000: 0x00000000 0x02373061 0x00007161 0x00000000
0000000002374010: 0x00000000 0x00000000 0x00000000 0x00000000
0000000002374020: 0x02453061 0x02457061 0x00001121 0x0000b161
0000000002374030: 0x00000000 0x00000000 0x00000000 0x00000000
The first page table entry is not mapped, so that we can easily detect NULL pointer references. This is incredibly important. The second page table entry points at 0x02373000.
Unfortunately though, this is not the page directory being used for the process. According to the crash screen (the last "Illegal page fault" posted if you scroll up a bit), CR3 is 0x02453000.
Since this was a new thread ("Handling connection") not working in this case, I started digging into the thread_create method. What surprised me there, when looking at the code, was that I couldn't actually find any code that would re-map the page directory for the new thread when setting up its structures. So this had to mean one or more of the following:
- I am blind, and missing something obvious.
- This has never worked (which seems utterly strange.)
- This has become broken in the branch I'm working on.
I thought option 3 was the most likely, so I looked at the diff for thread.c at GitHub's excellent web interface.
A surprised developer...
Imagine the look at my face when I saw this code being deleted in my diff:
    // Map the thread's page directory and update the mapping for the first pagetable.

#if FALSE
    new_page_directory[0].page_table_base = page_table_physical_page;
    memory_virtual_map_other(new_tss,
                             GET_PAGE_NUMBER(BASE_PROCESS_PAGE_DIRECTORY),
                             page_directory_physical_page, 1, PAGE_KERNEL);

    // The 4 MB region where the pagetables are mapped also need to be unique.

    memory_physical_allocate(&page_table_physical_page, 1);

    memory_virtual_map(GET_PAGE_NUMBER(BASE_PROCESS_TEMPORARY) + 1,
                       page_table_physical_page, 1, PAGE_KERNEL);

    memory_copy((uint8_t *) new_page_table, (uint8_t *) BASE_PROCESS_PAGE_TABLES, SIZE_PAGE);

    new_page_directory[8].page_table_base = page_table_physical_page;
    memory_virtual_map_other(new_tss,
                             GET_PAGE_NUMBER(BASE_PROCESS_PAGE_TABLES),
                             page_table_physical_page, 1, PAGE_KERNEL);
#endif
Again, the old saying of "question everything, even your own assumptions" holds true, again. This is the very code that breaks this, that is; the first part of it. This code should not be disabled!!!
It was even more surprising when I did a bit of git blame on the file just to see this:
742f5a01 (Per Lundberg 2007-02-27 08:49:37 +0000 278)
742f5a01 (Per Lundberg 2007-02-27 08:49:37 +0000 279) #if FALSE
3ec91907 (Per Lundberg 2015-03-18 22:42:29 +0200 280)     new_page_directory[0].page_table_base = page_table_physical_page;
3ec91907 (Per Lundberg 2015-03-18 22:42:29 +0200 281)     memory_virtual_map_other(new_tss,
3ec91907 (Per Lundberg 2015-03-18 22:42:29 +0200 282)                              GET_PAGE_NUMBER(BASE_PROCESS_PAGE_DIRECTORY),
3ec91907 (Per Lundberg 2015-03-18 22:42:29 +0200 283)                              page_directory_physical_page, 1, PAGE_KERNEL);
742f5a01 (Per Lundberg 2007-02-27 08:49:37 +0000 284)
3ec91907 (Per Lundberg 2015-03-18 22:42:29 +0200 285)     // The 4 MB region where the pagetables are mapped also need to be unique.
742f5a01 (Per Lundberg 2007-02-27 08:49:37 +0000 286)
3ec91907 (Per Lundberg 2015-03-18 22:42:29 +0200 287)     memory_physical_allocate(&page_table_physical_page, 1);
742f5a01 (Per Lundberg 2007-02-27 08:49:37 +0000 288)
3ec91907 (Per Lundberg 2015-03-18 22:42:29 +0200 289)     memory_virtual_map(GET_PAGE_NUMBER(BASE_PROCESS_TEMPORARY) + 1,
3ec91907 (Per Lundberg 2015-03-18 22:42:29 +0200 290)                        page_table_physical_page, 1, PAGE_KERNEL);
742f5a01 (Per Lundberg 2007-02-27 08:49:37 +0000 291)
3ec91907 (Per Lundberg 2015-03-18 22:42:29 +0200 292)     memory_copy((u8 *) new_page_table, (u8 *) BASE_PROCESS_PAGE_TABLES, SIZE_PAGE);
742f5a01 (Per Lundberg 2007-02-27 08:49:37 +0000 293)
3ec91907 (Per Lundberg 2015-03-18 22:42:29 +0200 294)     new_page_directory[8].page_table_base = page_table_physical_page;
3ec91907 (Per Lundberg 2015-03-18 22:42:29 +0200 295)     memory_virtual_map_other(new_tss,
3ec91907 (Per Lundberg 2015-03-18 22:42:29 +0200 296)                              GET_PAGE_NUMBER(BASE_PROCESS_PAGE_TABLES),
3ec91907 (Per Lundberg 2015-03-18 22:42:29 +0200 297)                              page_table_physical_page, 1, PAGE_KERNEL);
742f5a01 (Per Lundberg 2007-02-27 08:49:37 +0000 298) #endif
So, ten and a half years ago (2007-02-27), I supposedly disabled this stuff. Why?!?
I looked more carefully, but unfortunately it was already disabled in that commit (it just added this file to the repo, as part of importing the old code etc.) I looked in old SVN logs etc at Sourceforge, but couldn't find anything conclusive.
The fact that this code has been disabled is a very interesting finding. This means that a lot of things could potentially be broken. Perhaps this was the very thing that caused the memory allocation to fail to begin with, which led me to start refactoring the page table handling to use the "clever hack" approach of self-mapping the page directory as a page table etc...
I put back this commented-out code that I had deleted, and uncommented it. I also put back some other code that I had removed which was related to this.
Note to self and others: if you disable some code, perhaps for good reasons, write a comment to your future self explaining why it gets disabled. That way, you don't have to wonder 10 or 15 years later.
Double fault in the log server
Wow, I got a new crash this time! ![]()
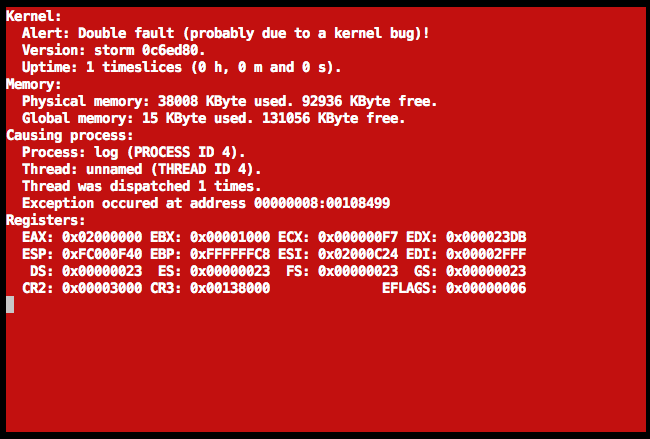
My bad. The "put back some other code" was broken; I was mixing up a virtual address with a physical page number... The last line here is the statement at fault here:
    // Clone the page directory and the lowest page table.
    memory_copy((uint8_t *) new_page_directory, (uint8_t *) BASE_PROCESS_PAGE_DIRECTORY, SIZE_PAGE);
    memory_copy((uint8_t *) system_page_table_physical_page, (uint8_t *) BASE_PROCESS_PAGE_TABLES, SIZE_PAGE);
I wonder how many hours, if not days I would have saved by now if we had an identity-mapped VM architecture in this system instead. As previously stated: if you are planning an operating system, use identity mapping from the start. I know I'm saying this a lot now, but it can't really be overemphasized since it makes everything much more complex if you are trying to be "too smart" and want to avoid identity-mapping, like we have been stupid enough in do in this case.
Page fault in the virtual_file_system server
I fixed this trivial bug, which gave me this. A new error:
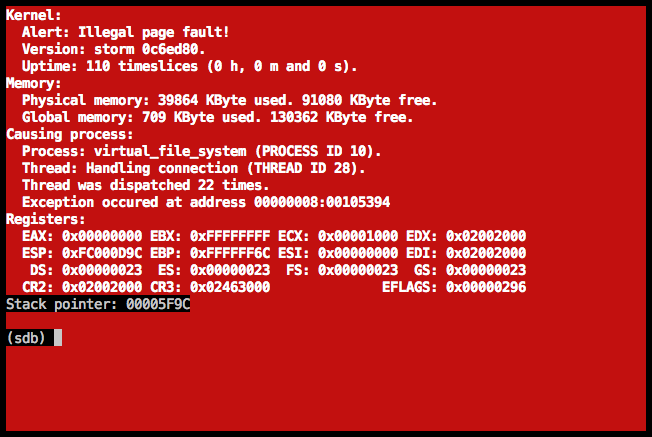
After spending some time away from the computer, I realized that the problem I was facing now was probably because of the latter part of the #if FALSE block needed to be adjusted. Think about it:
- We used to have code their that copied the mappings for the 4 MiB region used to manipulate the paging structures.
- Now, this code has been disabled for years, essentially breaking parts of the thread creation code. It was probably disabled for some reason, but it's hard to remember the exact details so many years later.
- The new code sets up a "magic" page directory entry, making this region be "self-mapping" to the page directory, as previously described in this blog post.
- However, when we create a new thread, even though we now create a new, distinct page directory for the new thread, we never update this mapping. So all new page tables being created for the new thread will be mapped using the page directory correctly (since that's the part we just fixed), but when writing the page table entries for it, we will write to the old thread's page table instead! And that's exactly why we're getting these page faults.
Sometimes it's just so good to be away from the computer for a while. It lets you think and get a whole new perspective. Let's check this idea now and see if it holds true or if it's just some creative imagination on my behalf!
Finally a new error: system_process_create failed
This is what it now gave me on startup:
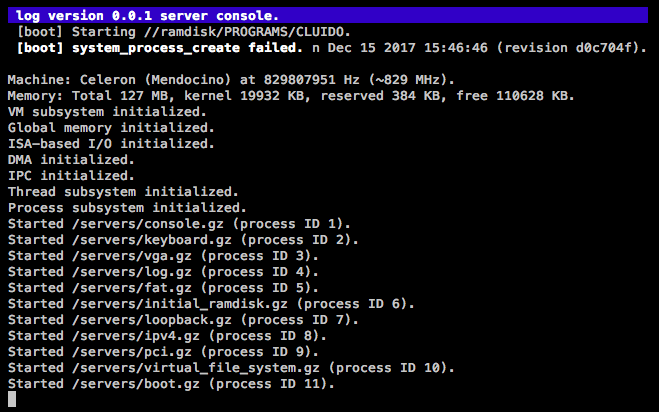
That's nice, in fact a much nicer error than the one I've been investigating recently.
I will willingly admit that this part of the low-level programming experience (debugging strange, really tricky problems that never seem to go away no matter how hard you try to wrestle with them) can be really painful and is not something I've yet learnt to appreciate fully... What drives me is an eager desire to understand the nature of the problem. It's not always fun debugging, but it's usually very very rewarding when you find the cause of the "sickness" in your code!
So, now we see that system_process_create failed. It has also failed to wipe the console on startup, so the text output looks a bit messy; I don't really know what is causing that.
(The error was coming from a library called execute_elf which had a very outdated formatting style - I fixed that before continuing, and also cherry-picked out more parts of my branch into separate PRs to keep the diff smaller - #112 and #114. Some of you may find it odd that I sometimes "pause" and fix other things. It's because, to me, reading a file with messy or outdated formatting is annoying. It makes it hard for me to focus on the real issue at hand. So, I find it easier to first fix the trivial formatting issues, even though it takes a little time, and then go back to the original task at hand. Again, I find this an application of the boy scout rule.)
The failing code looked like this:
        switch (execute_elf((elf_header_type *) buffer, "", &process_id))
        {
            case EXECUTE_ELF_RETURN_SUCCESS:
            {
                log_print_formatted(&log_structure, LOG_URGENCY_INFORMATIVE,
                                    "New process ID %u.", process_id);
                break;
            }

            case EXECUTE_ELF_RETURN_IMAGE_INVALID:
            {
                log_print(&log_structure, LOG_URGENCY_ERROR, "Invalid ELF image.");
                break;
            }

            case EXECUTE_ELF_RETURN_ELF_UNSUPPORTED:
            {
                log_print(&log_structure, LOG_URGENCY_ERROR, "Unsupported ELF.");
                break;
            }

            case EXECUTE_ELF_RETURN_FAILED:
            {
                log_print(&log_structure, LOG_URGENCY_ERROR, "system_process_create failed.");
                break;
            }
        }
The EXECUTE_ELF_RETURN_FAILED was a "fallback" return value for any kind of unhandled error coming from the system_call_process_create function (the method has been renamed since the string was written.) This feels like a good time to bring up a debugger again, don't you think? I did just that, and placed a breakpoint on that method.
Stepping through process_create
Stepping through the code seemed to indicate quite clearly what was causing this; code_section_base was zero which was not permitted:
Breakpoint 1, system_call_process_create (process_data=0xfffffaf8) at system_call.c:122
122 {
(gdb) step
123     return process_create(process_data);
(gdb)
process_create (process_data=0xfffffaf8) at process.c:125
125 {
(gdb)
129     page_directory_entry_page_table *page_directory = (page_directory_entry_page_table *) BASE_PROCESS_TEMPORARY;
(gdb)
130     uint32_t code_base, data_base = 0;
(gdb)
138     if (process_data->code_section_size == 0 ||
(gdb)
139         process_data->data_section_size == 0)
(gdb)
138     if (process_data->code_section_size == 0 ||
(gdb)
147     if (process_data->code_section_base < BASE_PROCESS_SPACE_START ||
(gdb)
151         return STORM_RETURN_SECTION_MISPLACED;
(gdb)
568 }
(gdb) print process_data->code_section_base
$1 = 0
(gdb) print/x *process_data
$1 = {process_type = 0x0, initial_eip = 0x49001f4f, process_id = 0x338d0, block = 0x20, code_section_address = 0xfffffb18,
  code_section_base = 0x0, code_section_size = 0x1, data_section_address = 0x38d0, data_section_base = 0xb,
  data_section_size = 0xb0005, bss_section_base = 0x38d0, bss_section_size = 0x1, parameter_string = 0x807000}
I didn't know the exact value of BASE_PROCESS_SPACE_START, but it was at least 0x02800000 according to the code + the virtual memory overview.
So, why was the process_data set up like this? The readelf output looked like this:
vagrant@debian-9rc1-i386:/vagrant$ readelf -S programs/cluido/cluido
There are 18 section headers, starting at offset 0x33600:

Section Headers:
  [Nr] Name              Type            Addr     Off    Size   ES Flg Lk Inf Al
  [ 0]                   NULL            00000000 000000 000000 00      0   0  0
  [ 1] .note.gnu.build-i NOTE            400000d4 0000d4 000024 00   A  0   0  4
  [ 2] .eh_frame         PROGBITS        400000f8 0000f8 0027a0 00   A  0   0  4
  [ 3] .eh_frame_hdr     PROGBITS        40002898 002898 0003dc 00   A  0   0  4
  [ 4] .text             PROGBITS        40003000 003000 009221 00  AX  0   0 16
  [ 5] .data             PROGBITS        4000d000 00d000 005be0 00  WA  0   0 32
  [ 6] .bss              NOBITS          40012be0 012be0 000308 00  WA  0   0 32
  [ 7] .comment          PROGBITS        00000000 012be0 000025 01  MS  0   0  1
  [ 8] .debug_aranges    PROGBITS        00000000 012c05 000200 00      0   0  1
  [ 9] .debug_info       PROGBITS        00000000 012e05 00c4ce 00      0   0  1
  [10] .debug_abbrev     PROGBITS        00000000 01f2d3 001fd8 00      0   0  1
  [11] .debug_line       PROGBITS        00000000 0212ab 003aa7 00      0   0  1
  [12] .debug_str        PROGBITS        00000000 024d52 003e48 01  MS  0   0  1
  [13] .debug_loc        PROGBITS        00000000 028b9a 008441 00      0   0  1
  [14] .debug_ranges     PROGBITS        00000000 030fdb 000f88 00      0   0  1
  [15] .symtab           SYMTAB          00000000 031f64 000b90 10     16  45  4
  [16] .strtab           STRTAB          00000000 032af4 000a52 00      0   0  1
  [17] .shstrtab         STRTAB          00000000 033546 0000b9 00      0   0  1
Key to Flags:
  W (write), A (alloc), X (execute), M (merge), S (strings), I (info),
  L (link order), O (extra OS processing required), G (group), T (TLS),
  C (compressed), x (unknown), o (OS specific), E (exclude),
  p (processor specific)
Nothing immediately strange here. I think we need to jump one level up in the call stack, into the execute_elf function and step through it to understand what is happening. I do remember I had to do some adjustments related to the ELF loading a few years ago, to be able to start servers properly from the kernel (i.e. not from the boot server) - see #9, but it seems pretty much unrelated. We don't have multiple .text* sections here, as can be seen in the ELF section header dump above.
Stepping through execute_elf
Anyway, stepping through execute_elf gave me the assumption that the flow worked basically okay. The code_section_base, data_section_base and other variables seemed to be set up correctly:
(gdb) info locals
section_header = 0x805910
index = 0x5
code_section_base = 0x40003000
data_section_base = 0x4000d000
bss_section_base = 0x40012bc0
code_section_size = 0x91f1
data_section_size = 0x5bbc
bss_section_size = 0x308
code_section_address = 0x7da000
data_section_address = 0x7e4000
I was starting to suspect that the elf_process_create structure being set up had a different format in the user-space definition vs the kernel-space definition (they are unfortunately separate files at the moment, IIRC...)
Breaking right before the system call was being made seemed to indicate that this assumption was correct:
Breakpoint 6, execute_elf (elf_header=0x7d7000, parameter_string=0x4900526c "", child_process_id=0xffffff78) at execute_elf.c:135
135     return_value = system_call_process_create(&elf_process_create);
(gdb) print/x elf_process_create
$7 = {process_type = 0x1, initial_eip = 0x4000bf24, process_id = 0xffffff78, block = 0x0, code_section_address = 0x7da000,
  code_section_base = 0x40003000, code_section_size = 0x91f1, data_section_address = 0x7e4000, data_section_base = 0x4000d000,
  data_section_size = 0x5bbc, bss_section_base = 0x40012bc0, bss_section_size = 0x308, parameter_string = 0x4900526c}
How about breaking right inside the system_call_process_create and see what it's view of that same data structure looked like?
Breakpoint 7, system_call_process_create (process_data=0xfffffaec) at system_call.c:122
122 {
(gdb) print/x *process_data
$9 = {process_type = 0x1, initial_eip = 0x4000bf24, process_id = 0xffffff78, block = 0x0, code_section_address = 0x7da000,
  code_section_base = 0x40003000, code_section_size = 0x91f1, data_section_address = 0x7e4000, data_section_base = 0x4000d000,
  data_section_size = 0x5bbc, bss_section_base = 0x40012bc0, bss_section_size = 0x308, parameter_string = 0x4900526c}
That's interesting - it looks identical. And, perhaps even stranger, when I now continued stepping through the code it didn't behave the same. It didn't return an error when validating the data; instead, it seemed to continue running just fine. Utterly weird!
KERNEL BUG: memory_global_allocate: Both tss_tree_mutex and memory_mutex were unlocked
I let it continue running, and now I got another error:
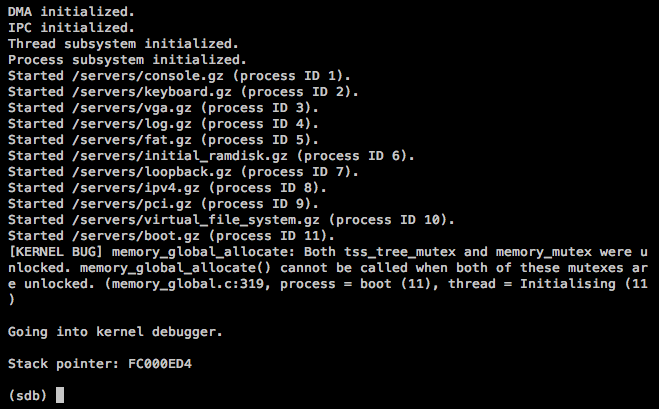
I tried placing a breakpoint on this line, but it wasn't so easy:
    if (initialised)
    {
        assert(tss_tree_mutex == MUTEX_LOCKED || memory_mutex == MUTEX_LOCKED,
               "Both tss_tree_mutex and memory_mutex were unlocked. memory_global_allocate() cannot be called when " \
               "both of these mutexes are unlocked.");
    }
The breakpoint would hit every time the assertion was checked, which kind of defeated the purpose... I decided to just let it crash and look at the backtrace instead:
(gdb) bt
#0  0x0010ff08 in debug_run () at debug.c:787
#1  0x001046f6 in memory_global_allocate (length=0x160) at memory_global.c:317
#2  0x0010722b in process_create (process_data=0xfffffaec) at process.c:177
#3  0x0011176b in system_call_process_create (process_data=0xfffffaec) at system_call.c:123
#4  0x0010bb77 in wrapper_process_create () at wrapper.c:779
#5  0xfffffaec in ?? ()
#6  0x49004971 in ?? ()
I looked at process_create, and it was quite obvious now why it would break. The method didn't actually do any locking of these mutexes. The reason why it had been working previously was that the initialised flag has been cleared, so the assertion was never checked.
KERNEL BUG: update_data: tss_node == NULL
I added the missing mutexing, but this gave me another error:
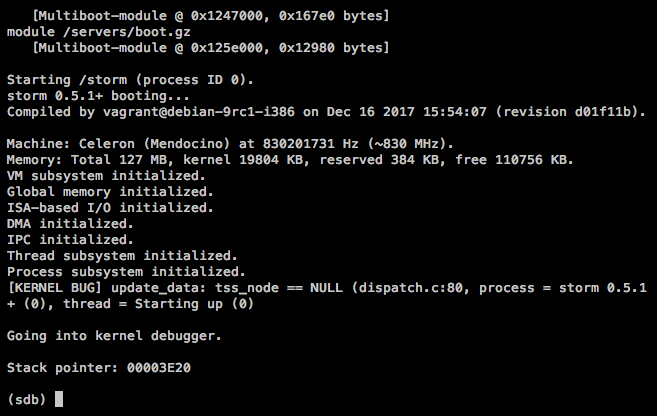
The problem here is that when called from the kernel context, the mutex is already locked. So it tries to dispatch the next task, long before the state of the system is such that it's really possible to dispatch another task...
I solved this by adding a condition to only grab and release the mutex if initialised was truthy. I also added better error checking to ensure dispatch_next never gets called prematurely:
    if (!initialised)
    {
        DEBUG_HALT("dispatch_next should never be called before the kernel initialization is complete.");
    }
(I am aware of the inconsistency between British and American English in the snippet above; I intend to harmonize it eventually. initialised should be renamed to kernel_initialized or something similar.)
"New process ID 12" - does that mean cluido started successfully now?!?
I now got this on bootup instead of the previous message. How cool!!!
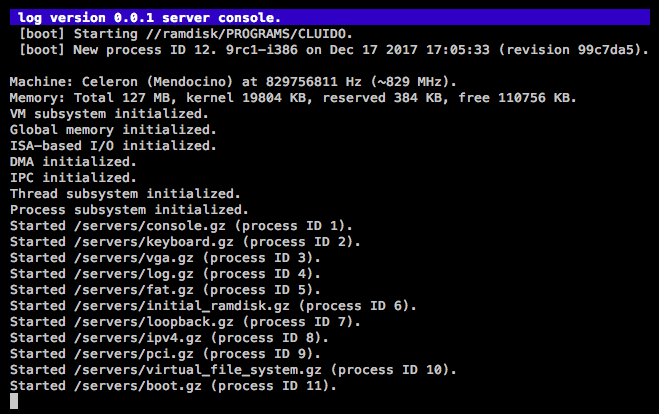
However, the virtual console which cluido opens was nowhere to be found; I couldn't find it by pressing Alt-F2, Alt-F3 etc. And, by looking at the boot server code now, something still seemed to be a bit strange:
    log_print_formatted(&log_structure, LOG_URGENCY_DEBUG, "Starting %u programs.", number_of_programs);
    start_programs(number_of_programs);

    system_call_process_parent_unblock();

    log_print(&log_structure, LOG_URGENCY_DEBUG, "Boot server completed.");
The start_programs part obviously were called, but it never after that got as far as printing "Boot server completed". That could of course be related to the LOG_URGENCY_DEBUG level; I think the DEBUG messages are not printed out by default.
Indeed; when I changed the setting for this in the log server, it printed ou the Boot server completed message and a bit more.
I decided to just try and put a breakpoint at the entrypoint of cluido, to see if it ever got scheduled by the dispatcher.
Looking at the console switching code
Stepping in the debugger indicated that the new cludio process was indeed being dispatched, and running without any apparent problems. So I wonder... could the problem just be that the console server doesn't switch the active console to newly created consoles right now? Let's find out; I looked at its source code and disabled the check below, to always activate newly created consoles.
                // Is this the first console? If so, activate it.
                if (current_console == NULL)
                {
                    current_console = *our_console;
                    (*our_console)->output = screen;
After the regular recompile/restart VM cycle, I got this on bootup:
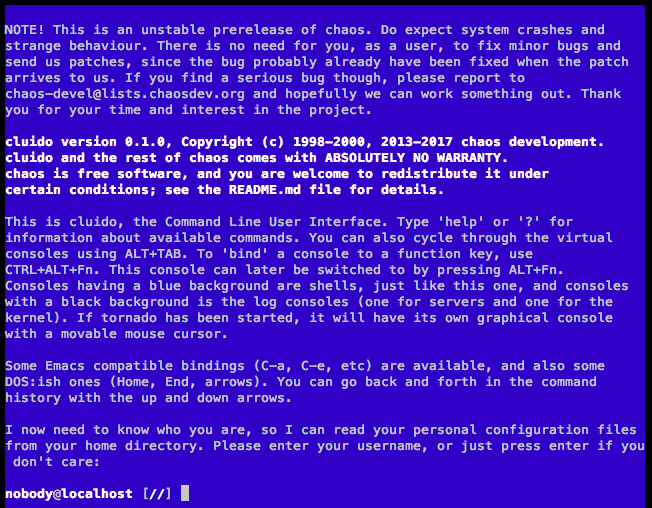
![]()
![]()
![]()
I can't really put words at how amazing this felt! For the first time in many years, Cluido was now startable the "right" way, by the boot server, reading a file from the VFS, propagating all the way down to the FAT server, which were loading the individual blocks from the initial ramdisk... The whole thing involves a significant level of complexity, given that this involves both the kernel and no less than four different user-level processes (boot, virtual_file_system, fat, initial_ramdisk.)
Honestly, I felt invincible. ![]()
These kinds of moments are what makes it all worth it. All the struggle, numerous nights spent at the computer when I had better be sleeping instead. All of a sudden, it paid dividends and suddenly felt much more worthwhile. There was actually a purpose in all of the work I had spent here. Glorious!
The virtual console switching did not seem to work well at the moment, but that wasn't really a major issue right now. The system seemed to be doing pretty fine overall. I was also able to list files, which can be seen below. The problem with all-uppercase path names can also be clearly seen in this somewhat messy screenshot (which is #107 being manifested.)
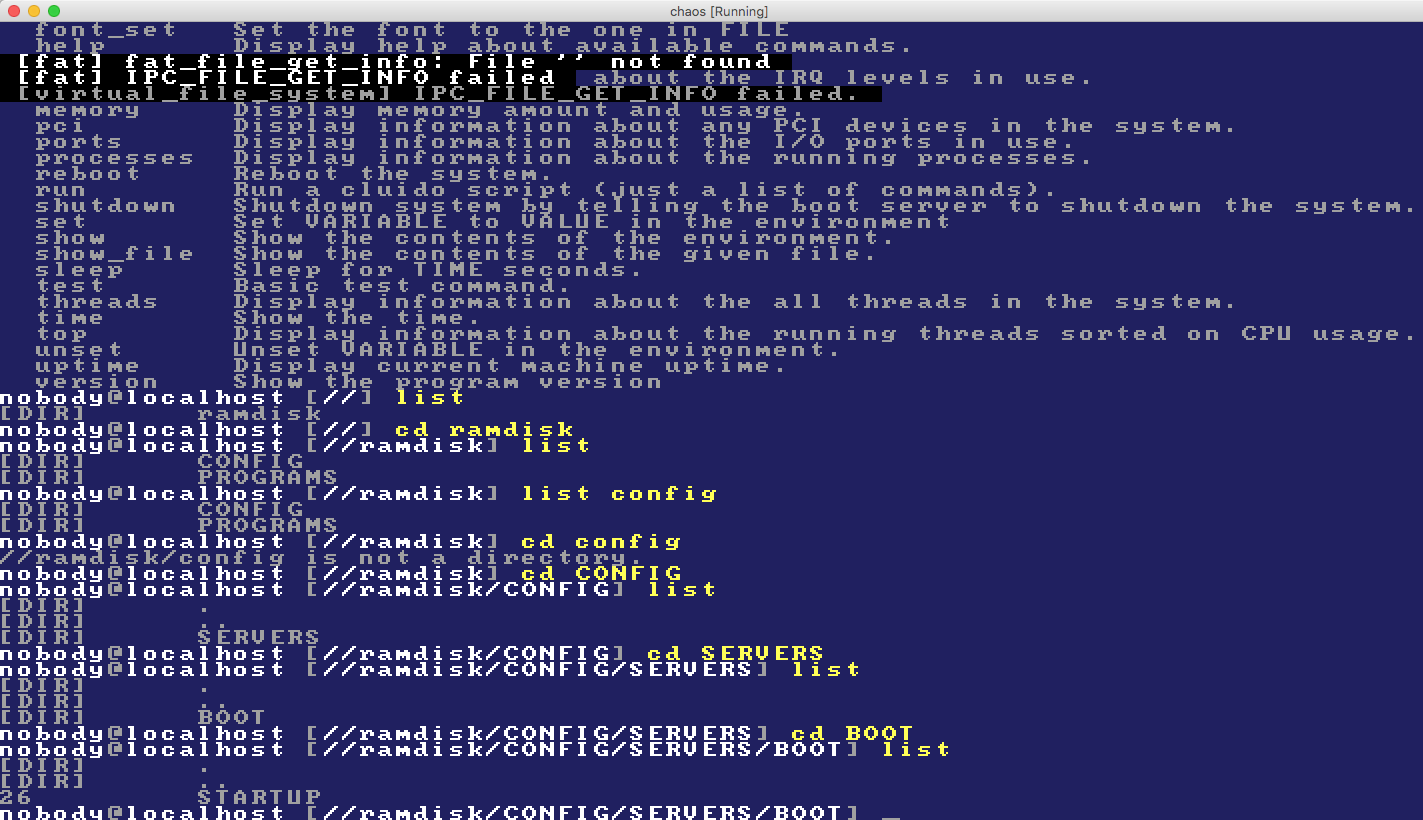
Conclusions
It's long overdue time to wrap this up (at almost 4000 lines; I have never before in my entire life written a Markdown document this long), so let's try to summarize some of the thoughts gathered while doing this whole "exercise".
-
Never give up. Even when you are at your lowest point, feeling like you'd better just
rm -rfthe whole project folder, throw your machine out the window or whatever. We all have these moments; it's just a matter of what we do with them. Remember the old saying: "What doesn't kill you makes you stronger."(This debugging would probably have been more efficient if I would have sat and debugged it all day long until it was completed, but for various reasons like "real life", that didn't happen. And, it's also a bit hard to keep the motivation up if you do it like that anyway, so perhaps it wasn't just bad that it was a bit split up.)
Question everything, including your presumptions, the compiler, the virtual machine execution environment - everything. Do not assume anything, except that there is a reason for the problem you're currently chasing. There is a solution - you just haven't found it yet.
Don't let anyone say that you are too "young", too "inexperienced" or anything other foolish. Don't listen to them! You can do it! Live your dream, spend time working on the things you love. You might not in your entire life be able to do it "for a living", but so what? Then you at least spent time doing meaningful things.
Be prepared that "that little thing" someone (you, your manager, colleague, whoever) is thinking about working on can be significantly harder than you first expect. It can be the tip of the iceberg, revealing a horde of other problems. First you solve one problem, only to discover the next, which you work with for a while, and once you think you are ready... the next big thing appears. You can get sidetracked multiple times during this time, because the process is so long. This is to be expected, don't be surprised if it happens. Keep reiterating what the bigger plan is, and what you are trying to achieve. Don't be afraid to "pause" the work for a while, spending time with your family, exercising, working in the garden - that's just good; it will help you mentally process the problems with the "background thread" that is (at least for me) often running while I do other things than sit at the computer.
-
Some traditional, "conventional wisdom" regarding debguging in general.
- Use a debugger if you can. The ability to inspect the values of your program while it's running is absolutely invaluable. Spending the necessary time getting the debugger working is usually well worth it, since it pays off in the long run.
- Try to minimize concurrency while debugging. If you can reproduce the problem in a non-concurrent way, it will be much easier for you to find the problem.
- Work your way towards the solution, like I have elaborated (quite at length!) here in this blog post. Take a small step in the right direction, and you will eventually get there. You don't know what the right direction is? Don't worry, take a small step in any direction! Eventually you will see whether it's getting "darker" or "lighter". Don't be discouraged when it takes time; debugging hard problems takes a lot of time. Don't expect anything else.
- Don't be too proud to ask for help. Use the knowledge and experience of your peers and colleagues; they are there for a reason. If you don't have people to ask (which has unfortunately been the case here), read blogs, wikis and other sources of information. Consider writing a blog about your experience like I've done; it can actually help you keeping "on track" and it's also incredibly useful to just "write down" your thoughts - it will help you think in new directions, and sometimes actually be "the key" to finding that incredibly important thought that leads you right to the solution... If not for anything else, write the experience down and then delete the document if you're not happy enough to show it to anyone! Just writing it down will be of great help, according to my experience.
If anyone read this far, I would be incredibly thankful if you could drop me a line saying what you (honestly!) felt about this blog post. My email address can be found at my GitHub profile: https://github.com/perlun/