JRuby memory leak hunting: Wrestling with a gigantic RubyObjectVar5
Because of a problem in a customer environment noticed recently, it's once more time to put on the "memory leak debugging hat". Join me and we'll see where the adventure takes us this time!
(This post is similar to my previous post: http://perlun.eu.org/en/2017/09/26/more-memory-leaks-jvm-and-jruby, but the customer environment is running a more recent version of the server this case, so the underlying problem is likely to be different.)
Getting the heap dump
Based on the instructions given at docs.oracle.com, I tried this command first to create a dump (since jmap which I've previously used is no longer available in the Java Server JRE.)
jcmd 2892 GC.heap_dump filename=d:\ecraft\java-heapdump.hprof
Strangely enough, the file did not appear in the expected location. I was suspecting the problem was with forward- vs backward slashes, so I tried again:
jcmd 2892 GC.heap_dump filename=d:/ecraft/java-heapdump.hprof
However, this time it complained that the file did already exist. That's a bit weird. I switched to using a non-fully-qualified path (filename=java-heapdump.hprof) but it still gave me the same error.
The issue turned out to be that filename had been chosen as the name of the file. And it was created in the process' current working directory, so when I looked there the file was indeed present (from the first time I ran the command.) Wonderful, Oracle! ![]()
Struggling with the Eclipse Memory Analyzer
Then, I tried to run the Eclipse Memory Analyzer (also known ad MAT), which failed. It couldn't even start on my Mac with High Sierra. Strangely, it worked when I moved the mat.app folder from the Downloads folder to /Applications - there must be something with this app that only works properly when it is "installed" as a regular application.
Once the Memory Analyzer would load, it would still not work. None of the buttons in the UI would do anything when I clicked it. It would just sit there and look like this:
The reason why I had to download it again since last time is because I've switched to a new Mac. Luckily though, I still had the old machine next to me and available via SSH so I copied over the application files from it - maybe it would work better with that version of the tool.
Interestingly enough, it did (I could now run it from the ~/Downloads folder), but the UI was still impossible to use - it didn't respond at my mouse clicks. I decided to go with a "Windows-style" solution for now and just reboot the whole machine.
Very strange - the reboot did not help a single thing. I googled and found this bugs.eclipse.org thread that led me to this git commit in Eclipse. I tried tweaking Contents/Info.plist in the same manner, to no avail - it still didn't work.
I then tried to install the legacy Java 6 runtime from Apple. Maybe, just maybe it would help to just install it and then try re-running the MAT?
Unfortunately not. However then running it with Java 6 (instead of Java 8 which is my current default)? This did not work. Apparently, according to this Eclipse wiki entry, Java 8 is required for Eclipse (including the Memory Analyzer, supposedly) nowadays. I also tested another Java GUI application (SQL Workbench, to be more specific), which worked fine with Java 8.
Maybe it would work better with Java 9; I've deliberately stayed out of it yet (since I had some problems with certain apps when trying it a few months ago), but it's time to do the upgrade anyway... I downloaded Java 9 from www.oracle.com and installed it, but it worked equally poorly.
I decided to "cheat" for now and use a Windows VM for the analysis instead. (I also tried the "other" MAT version, but it was equally broken on Java 9.) At last, I managed to get it to start. Let's head right at the "leak suspects".
Looking at "leak suspects report"
This is what it looked like:
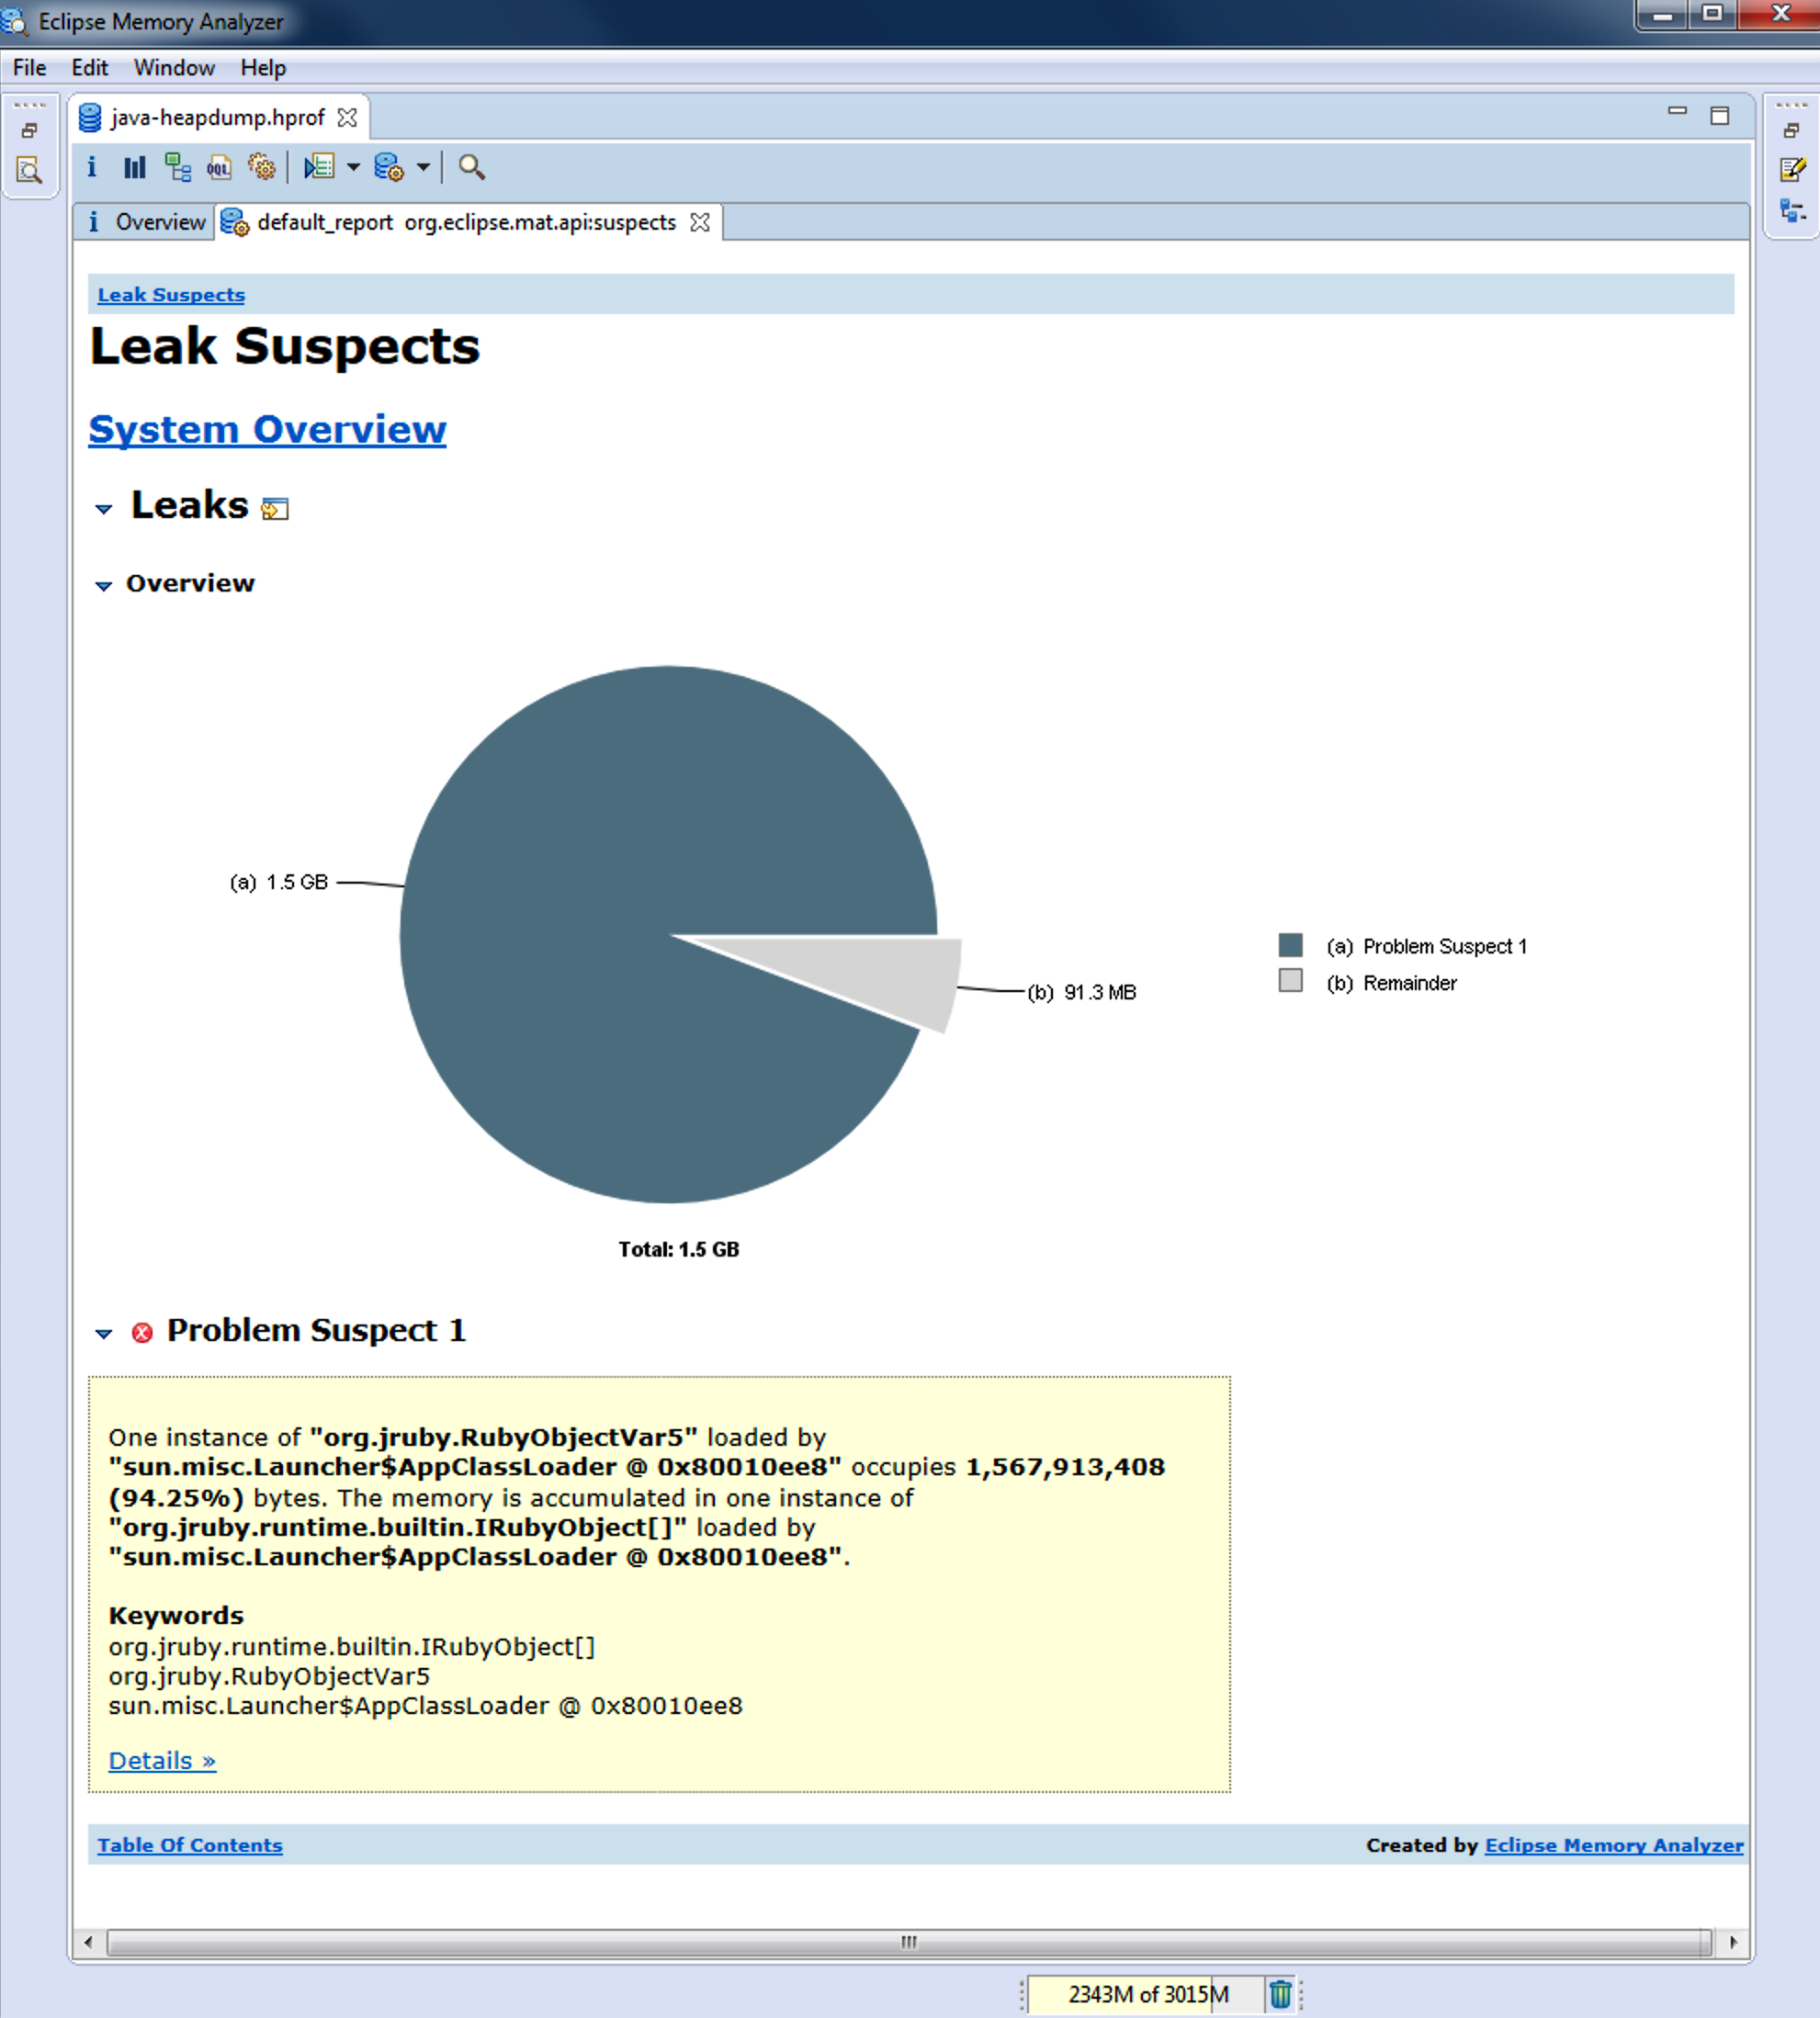
Just like the last time, we see a very clear leak suspect. But - a different suspect than last time. Last time, we saw an enormous amount of classes having been created, because we used Log4r::Logger in a silly and stupid way. This time, the problem seems to be of a somewhat different nature.
In the previous run, we had about 40 000 MetaClass instances, but what's very interesting this time is that we have one, incredibly huge instance of RubyObjectVar5, consuming a whopping 1,5 gigabyte of RAM. Looking at the source code of this class is interesting - I didn't know anything about it before this debug session. The class-level comment says like this:
/**
 * A RubyObject that provides a direct field for six stored variables, to avoid
 * the overhead of creating and managing a separate array and reference.
 */
So this is merely a container object; one or more of the stored variables is likely to be a larger problem than this class itself. I dug deeper:
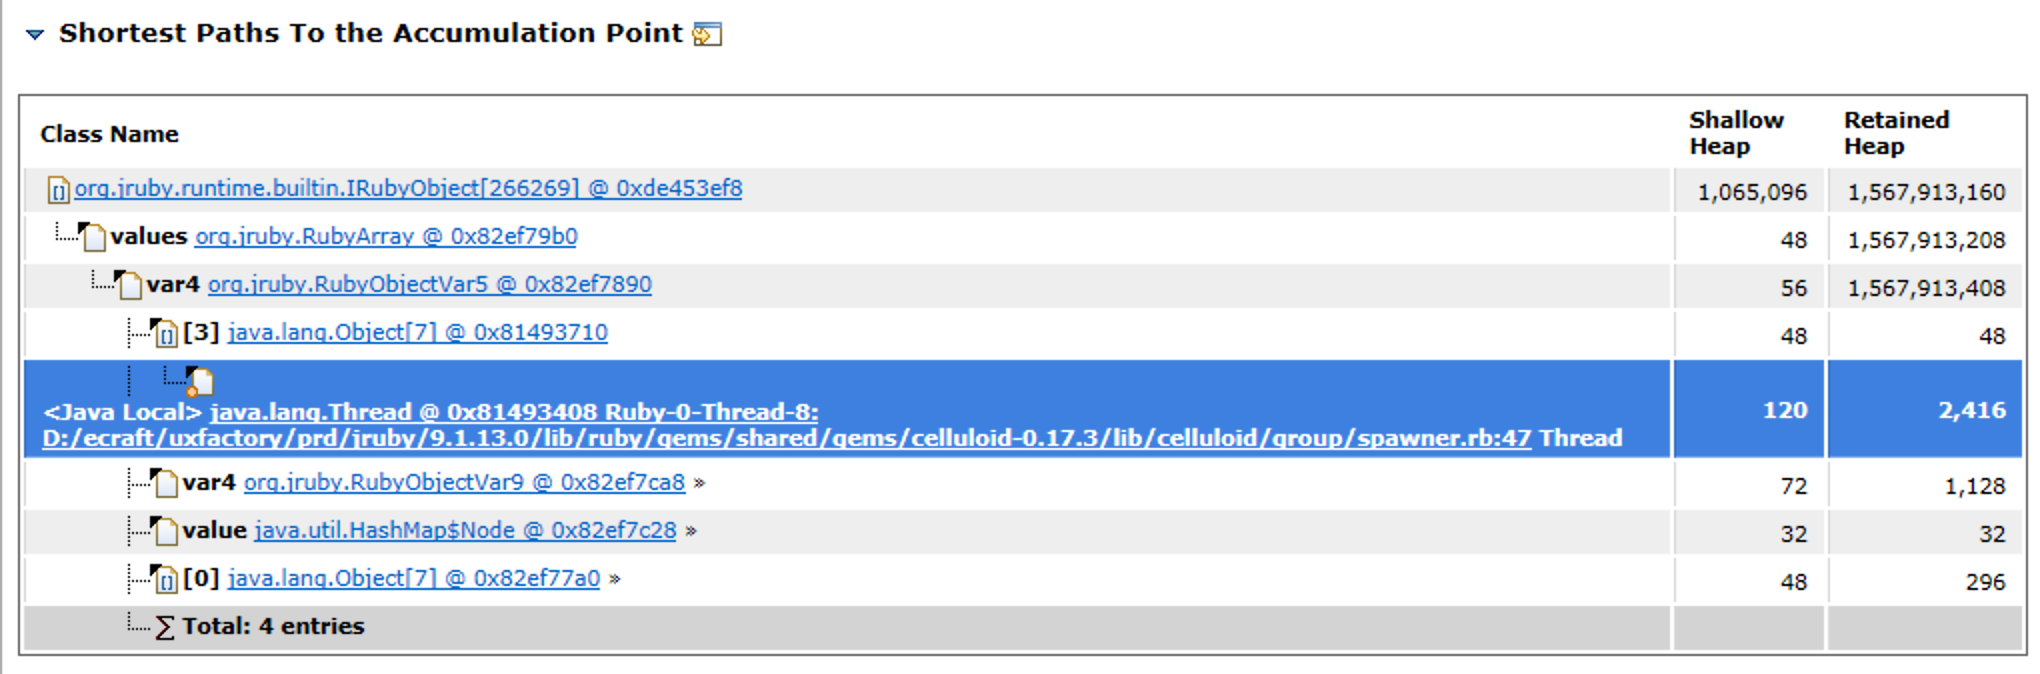
Celluloid is a part of the stack trace. It doesn't have to be a part of the problem, but it's still an interesting fact. Celluloid is an actor-based concurrency framework that looked promising a few years ago, but where development was unfortunately stalled and the last stable release is two years old at the time of writing this. We have moved away from Celluloid in our applications, and in the more recent versions of our application server, the dependency is removed altogether.
I continued looking and noted something interesting in "Accumulated Objects by Class in Dominator Tree":
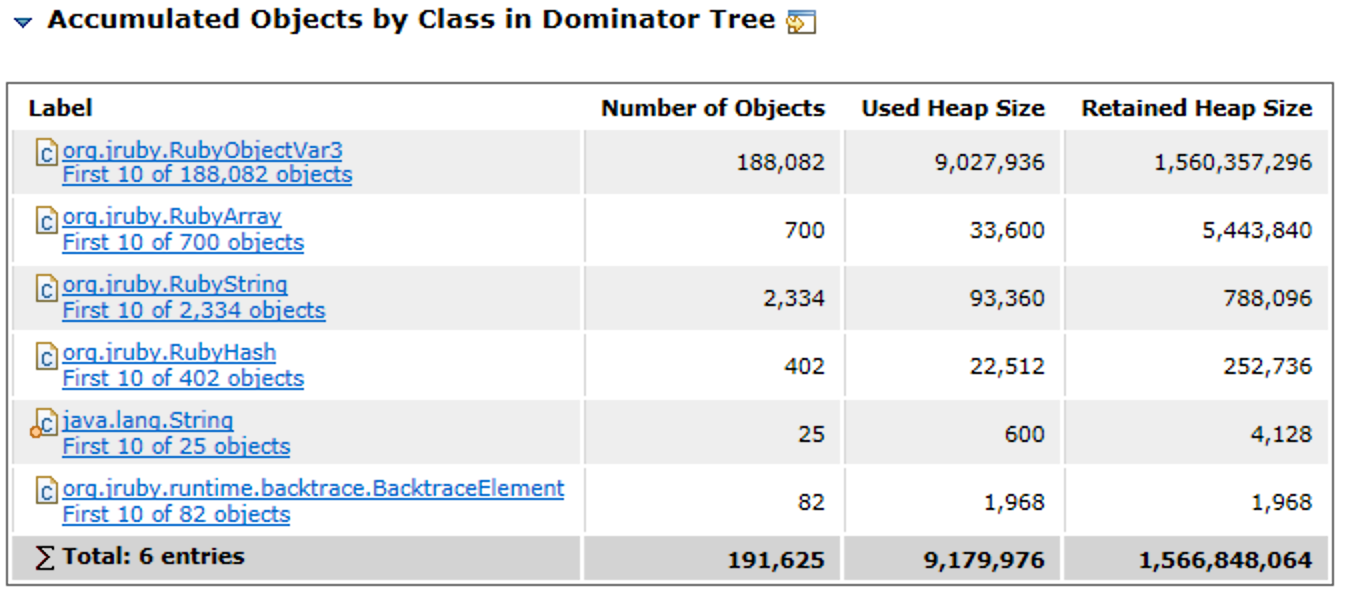
We're getting closer! 188 000 objects of RubyObjectVar3 doesn't seem very sane, especially since these consume all of these 1,5 GiB. I decided to dig right into OQL (Object Query Language and see what it would give us.
The query:
SELECT
  var0.toString(),
  var1.toString(),
  var2.toString(),
  var3.toString()
FROM org.jruby.RubyObjectVar3
...would give me this result:
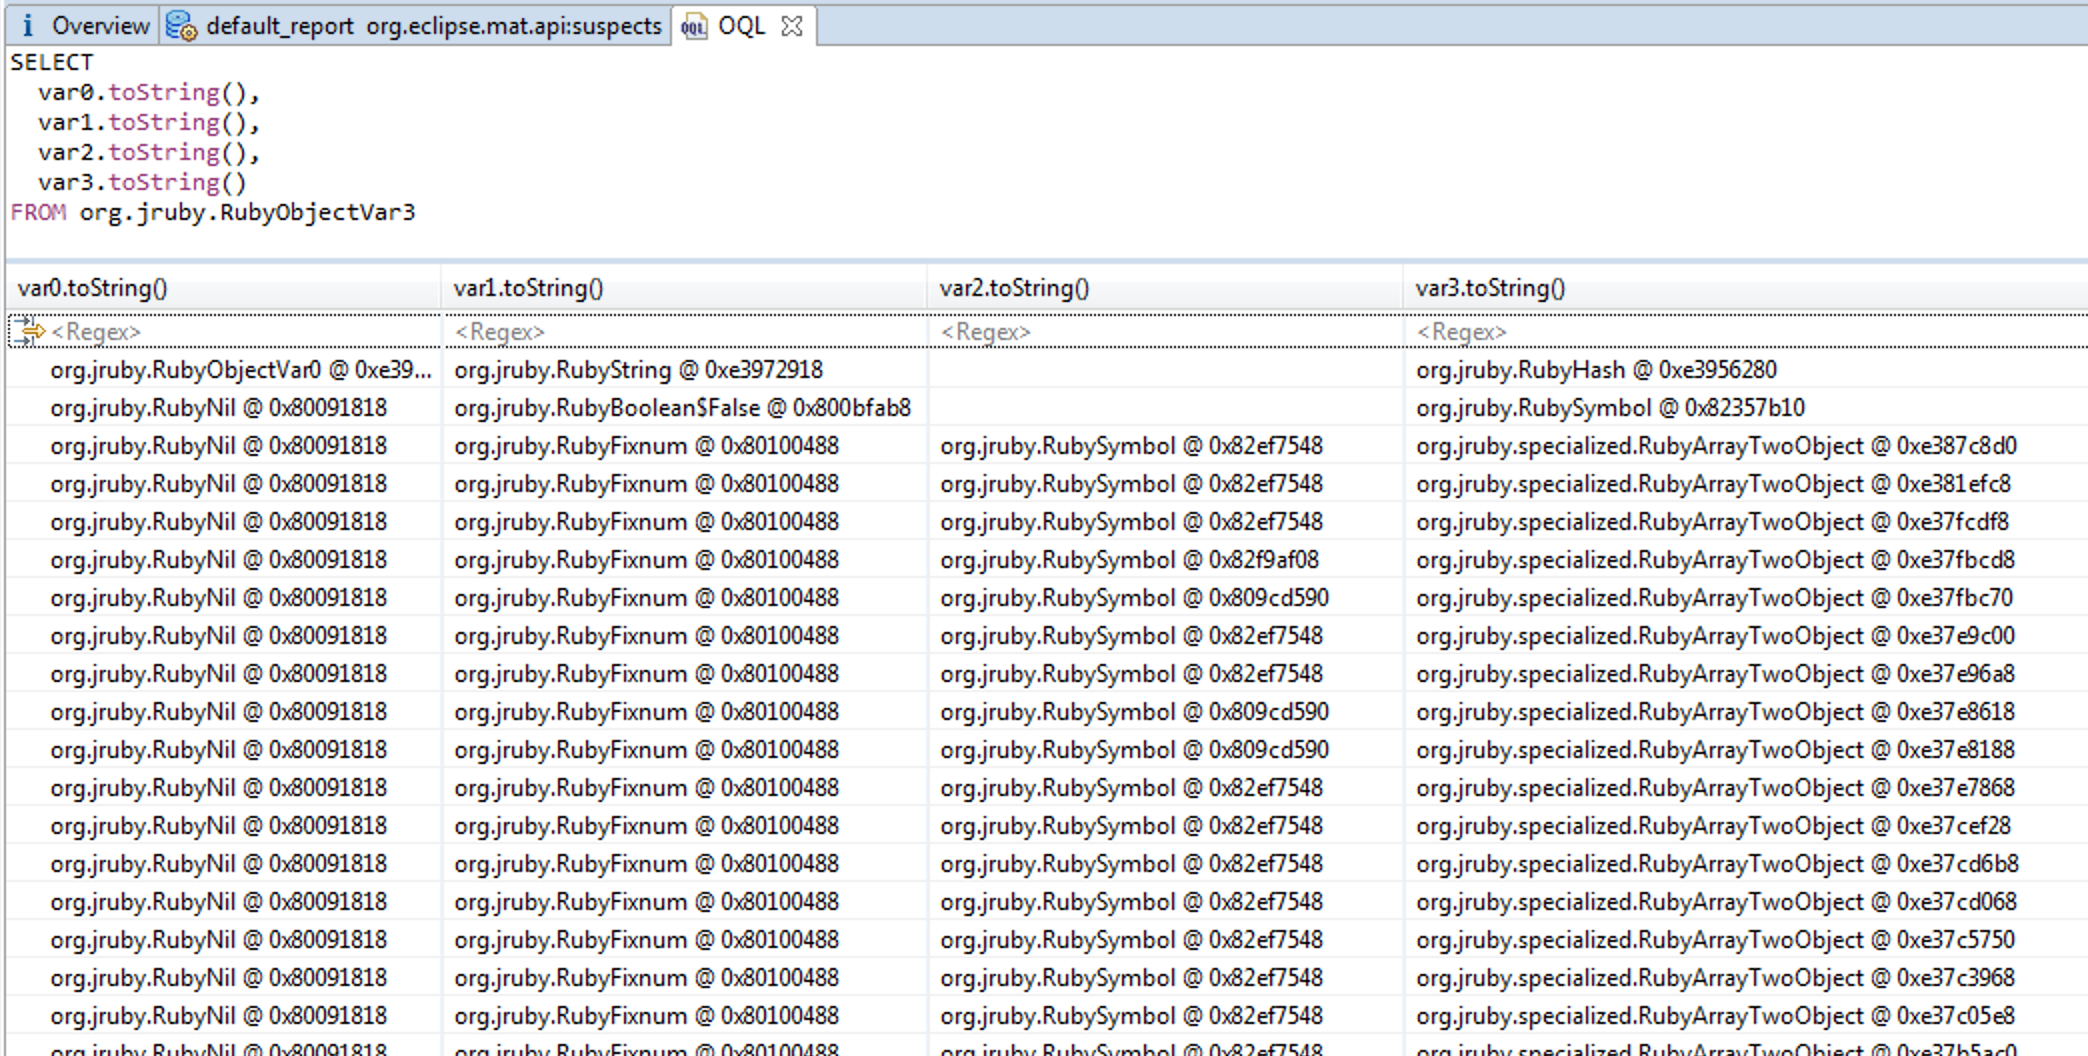
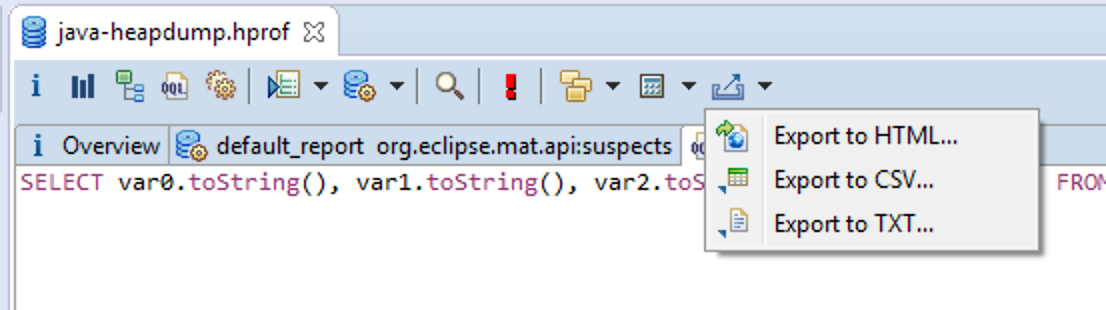
Not incredibly helpful yet, but we're definitely seeing a pattern. I once more saved the result to a CSV file for further analysis, using the somewhat-not-easy-to-find button in the UI for exporting:
The analysis showed that the pattern was indeed a pattern. A huge number of RubyArrayTwoObject instances in this list:
$ cat foo.csv | grep RubyArrayTwoObject | wc -l
188085
What I now wanted to do was to get more data from these RubyFixnum, RubySymbol and RubyArrayTwoObject instances. I tried to formulate a more sophisticated OQL query, but it was hard; OQL is rather limited in its querying capabilities. Looking at the JRuby source code on GitHub helped me massively in this task, since OQL allows you to call methods on the objects on the heap (but this presumes that you know the names of these methods...) That didn't work flawlessly, I got strange errors like this even for methods that should exist:
Problem reported:
Method getLongValue() not found in object org.jruby.RubyFixnum [id=0x80100488] of type org.eclipse.mat.parser.model.InstanceImpl
Anyhow. After a while, I managed to come up with this query:
SELECT
  var0.toString(),
  var1.value,
  var2.symbol.toString(),
  var3.car.pattern,
  var3.cdr
FROM org.jruby.RubyObjectVar3 WHERE (var1.toString() LIKE ".*RubyFixnum.*")
It was in no way pretty, but it gave me this result:
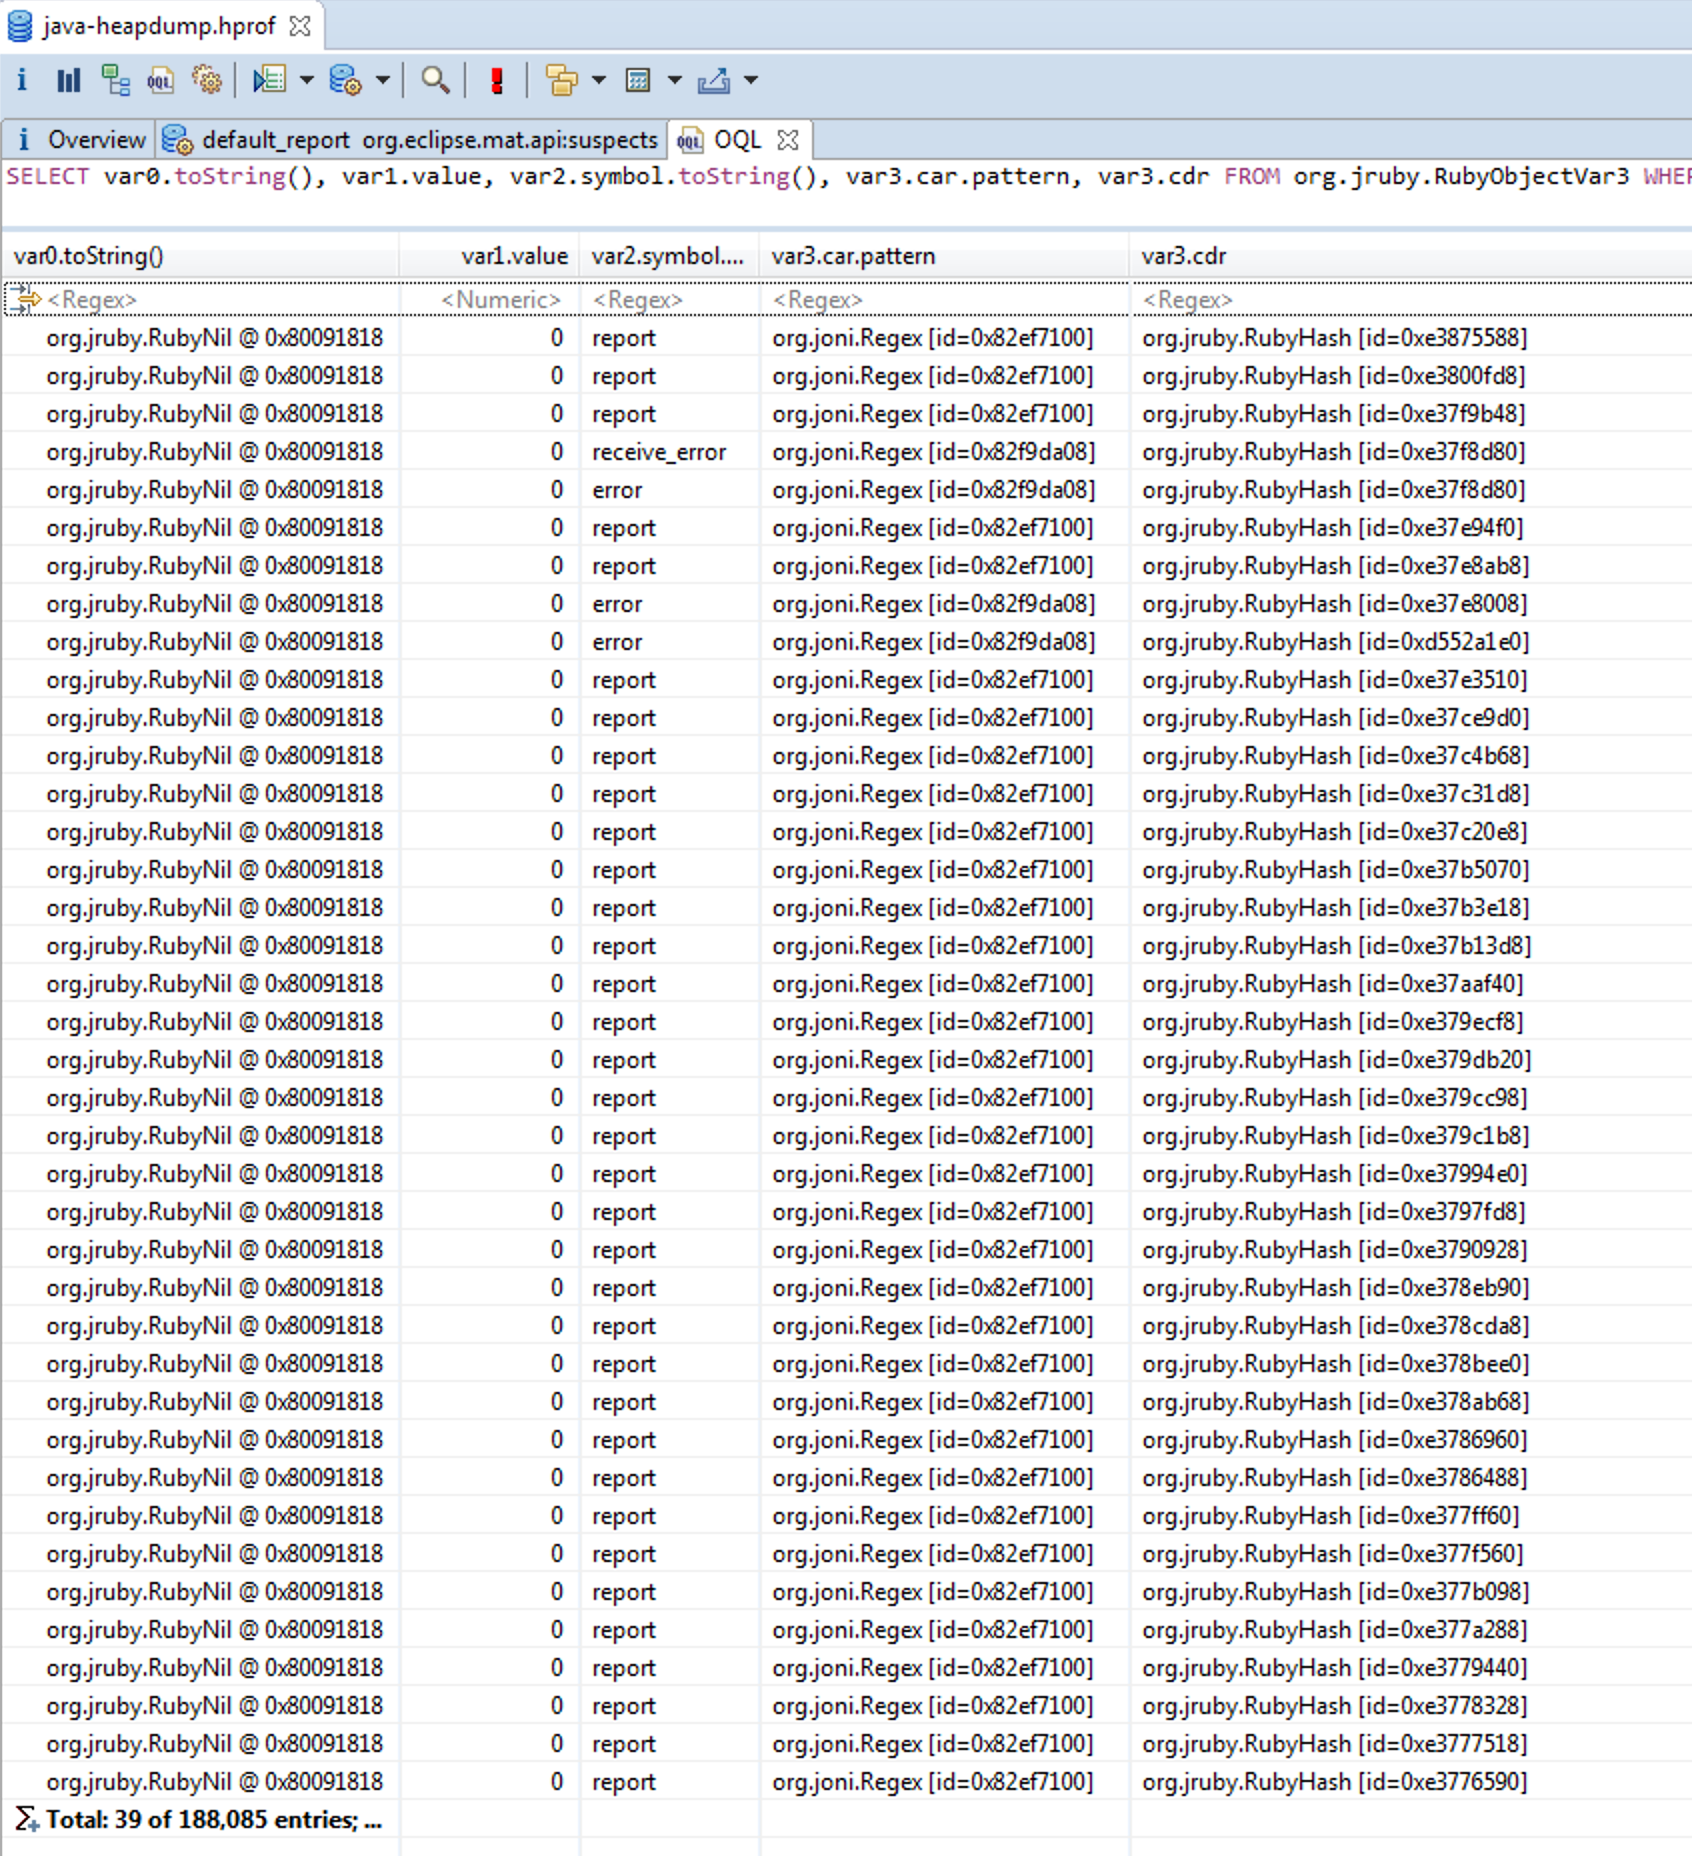
I extracted this result once more to a CSV file. The report key is clearly a key in revealing the source of this mystery; it is present in almost all of these rows.
$ cat foo.csv | awk -F, '{ print $3 }' | sort | uniq -c
    203 error
      2 receive_error
 187880 report
      1 var2.symbol.toString()
I looked at the code of our application server. Indeed, the word report was used there in a few places. We are using the mechanism in the previously mentioned Celluloid library for publishing and subscribing to messages, like this:
class SomeReceivingClass
  def initialize
    subscribe(/errors/, :error)
    subscribe(/applog/, :report)
  end
end

class SomePublishingClass
  def some_method(request, status, headers, body)
    publish(/applog/, create_log_entry(request, status, headers, body))
  end

  # ...other methods removed for the sake of brevity.
end
It's incredibly interesting that both of these method names - error and report are actually present in the list above. We are likely getting closer and closer to the source of the problem now.
Conclusions and wrapping up
The engineer in me want to continue investigating this more, until we are really "done" with it and know for sure what is the root cause here - are we using Celluloid in the wrong way, or is there indeed a bug in this library that causes memory to not be freed correctly? (I looked briefly at one of their examples and it seems to be reasonably close to how we're using it; it could actually be that this problem only occurs on JRuby, for example.)
However, the pragmatist in me also knows that we have abandoned the Celluloid ship. We're no longer sailing with it; this particular memory leak (possibly the last known one in our application server?) is likely already fixed by the refactoring of the code above that has already taken place. So, just upgrading this customer environment to use the latest version of the application server is a good start - if the problem remains after that, we'll have to revisit the issue once more.
The debugging session in itself was interesting though; it was completely different than the last time. I struggled for a long time just getting the tool operational, and once that was done, I had to try and attack the problem from a somewhat different angle than before. I learned a bit about the JRuby internals in the process, which is always a good thing. If this blog post helped you in any way, I'm even more happy about it!